– 24 –
■ Resistor 3 (Violet, Green, Black, Gold)
Analysis – Step 1
Input the data on your graphic calculator and graph it.
Analysis – Step 2
Use the graphic calculator to determine the slope of the line.
a = 13.6 10
–3
Analysis - Step 3
Determine the resistance value.
R = 74Ω
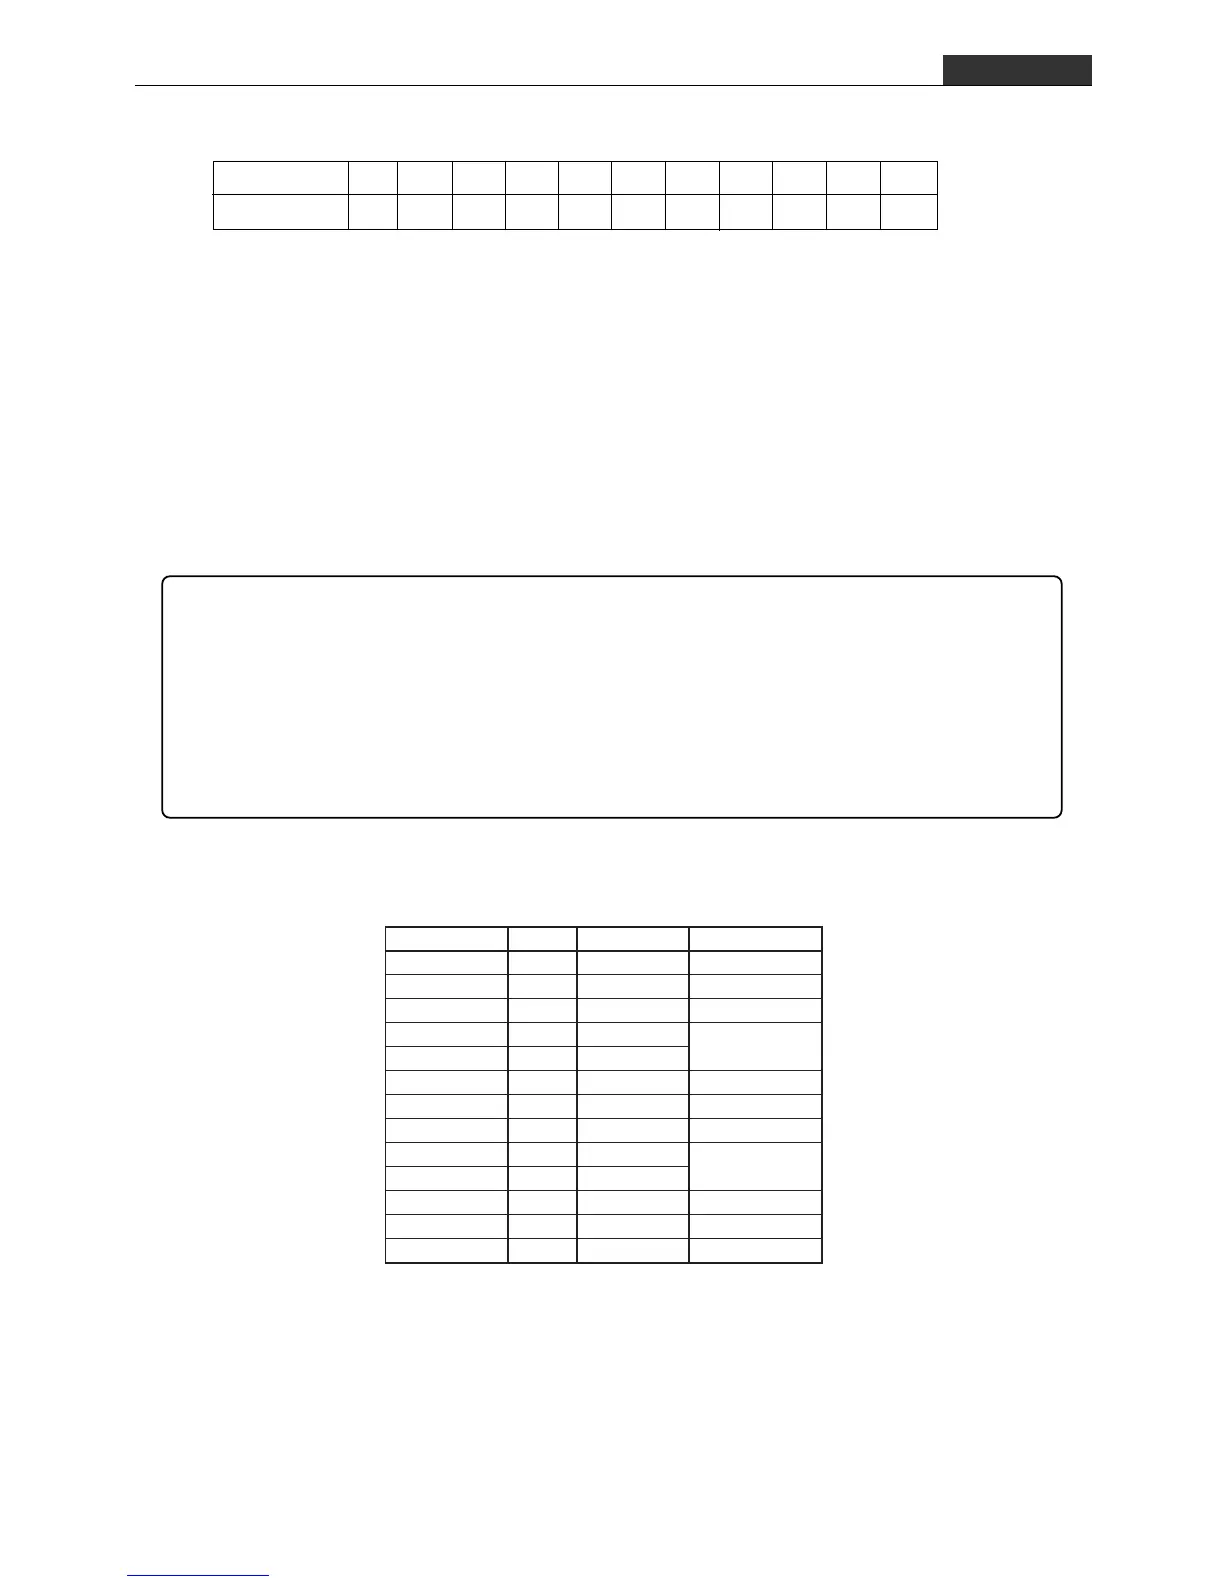
Other Things To Do 1
After determining the resistance values of all three resistors, check their actual values
using the resistor color code chart below.
Other Things To Do 2
There is some difference between the resistance values calculated in the experiment
and actual resistance values. What is the reason for this difference?
Voltage (V) 0 0.2 0.4 0.6 0.8 1.0 1.2 1.4 1.6 1.8 2.0
Current (mA) 0 2.8 5.6 8.3 11.1 13.8 16.5 19.2 21.8 24.5 27.3
EE-2 Ohm’s Law
Resistor Color Code Chart
Color Value
Multiplier
Tolerance (%)
Black
01 —
Brown
110 ±1
Red
210
2
±2
Orange
310
3
—
Yellow
410
4
Green
510
5
±0.5
Blue
610
6
±0.25
Violet
710
7
±0.1
Gray
810
8
—
White
910
9
Silver
—10
–2
±10
Gold
10
–1
±5
None
—— ±20

 Loading...


