– 50 –
•
Graph Settings
Configure settings for the
X-axis and Y-axis ranges and
scales.
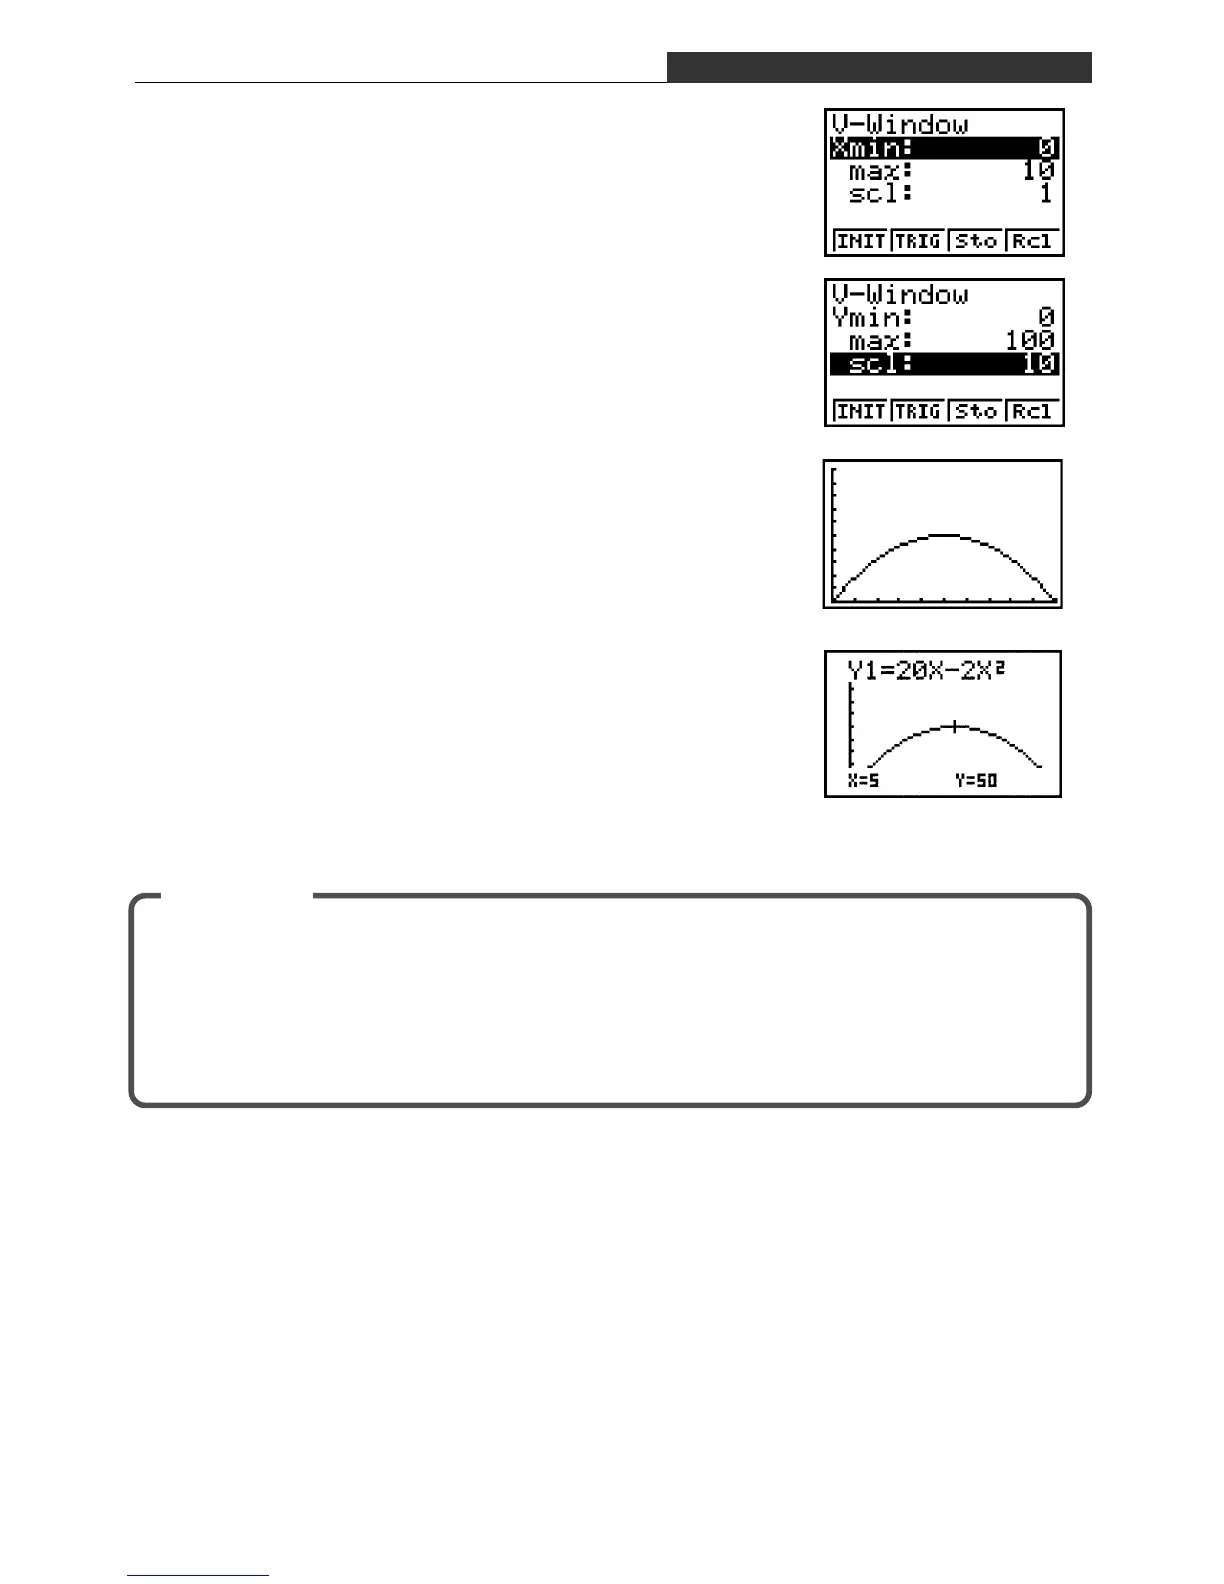
View Window Settings
Input the X-axis range and scale values shown on the
screen nearby.
!3 (V-WIN) 0 w10 w1 w
Next, input the Y-axis range and scale values.
c 0 w100 w10 ww
•
Graphing
Press 4(DRAW) to select DRAW.
This displays a graph like the one shown nearby.
•
Trace
Use trace to find out the maximum value.
!1 (TRCE)
Moving the cursor to the apex of the curve reveals that y =
50 (the maximum value) when x = 5.
This exercise shows that the cross-sectional area depends on where the sheet metal is bent.
You can determine the best location for the bends by observing where on the X-axis the
maximum value of Y is reached.
Check the x and y range settings before performing the operation.
Summary
AR-1 Economy of Materials (Cross-sectional Area)

 Loading...


