– 65 –
Q-2 Component Quality Variation Control (X-R Control Chart)
m 2
1(GRPH)[4(SET)
1(GPH1)
c2(xy)
c1(List1)c[1(List5)
cc1( )
fffff2(GPH2)
c2(xy)
c1(List1)c2(List2)
cc3( • )
fffff3(GPH3)
c1(Scat)
c1(List1)c3(List3)
cc3( • )
!m1(Auto)Q
Q1(GRPH)[1(SEL)1(On)
c1(On)c1(On)
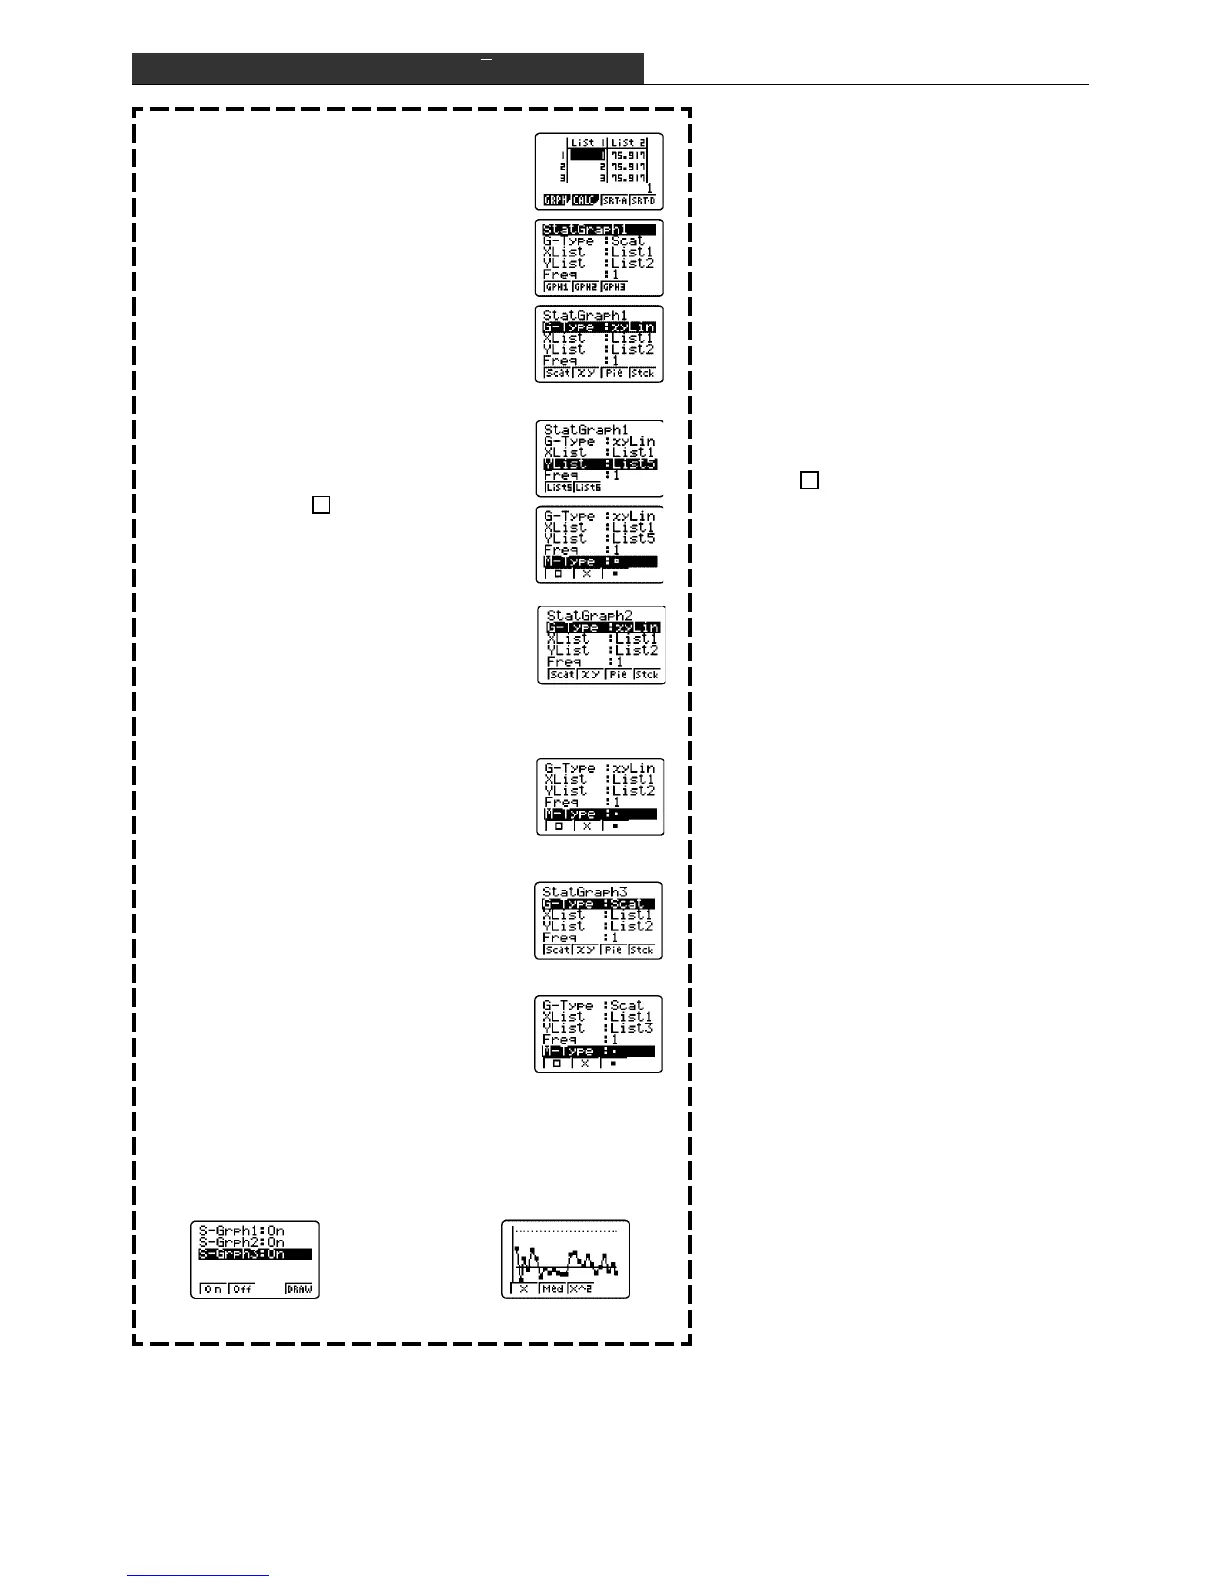
:From the Main Menu, enter the STAT
Mode.
:Display the graph setting screen.
: Select StatGraph1.
: Select xy Line.
: Specify List 1 (group numbers) for the
horizontal axis.
Specify List 5 (data) for the vertical axis.
: Specify as the mark type.
: Select StatGraph2.
: Select xy Line.
: Specify List 1 (group numbers) for the
horizontal axis.
Specify List 2 (mean values) for the
vertical axis.
: Specify • as the mark type.
: Select StatGraph3.
: Select Scatter plot.
: Specify List 1 (group numbers) for the
horizontal axis.
Specify List 3 (UCL) for the vertical axis.
: Specify • as the mark type.
: Specify AUTO as the graph mode.
:Turn on graphing for Graph 1, Graph 2,
and Graph 3.
:Draw the graphs.
This is a control chart for a stable situation.
Try drawing Graph 3 using the LCL (List 4) for YList.
As an exercise, change some of the data and try drawing an unstable control chart.
4(DRAW)

 Loading...


