20050401
5-2-6
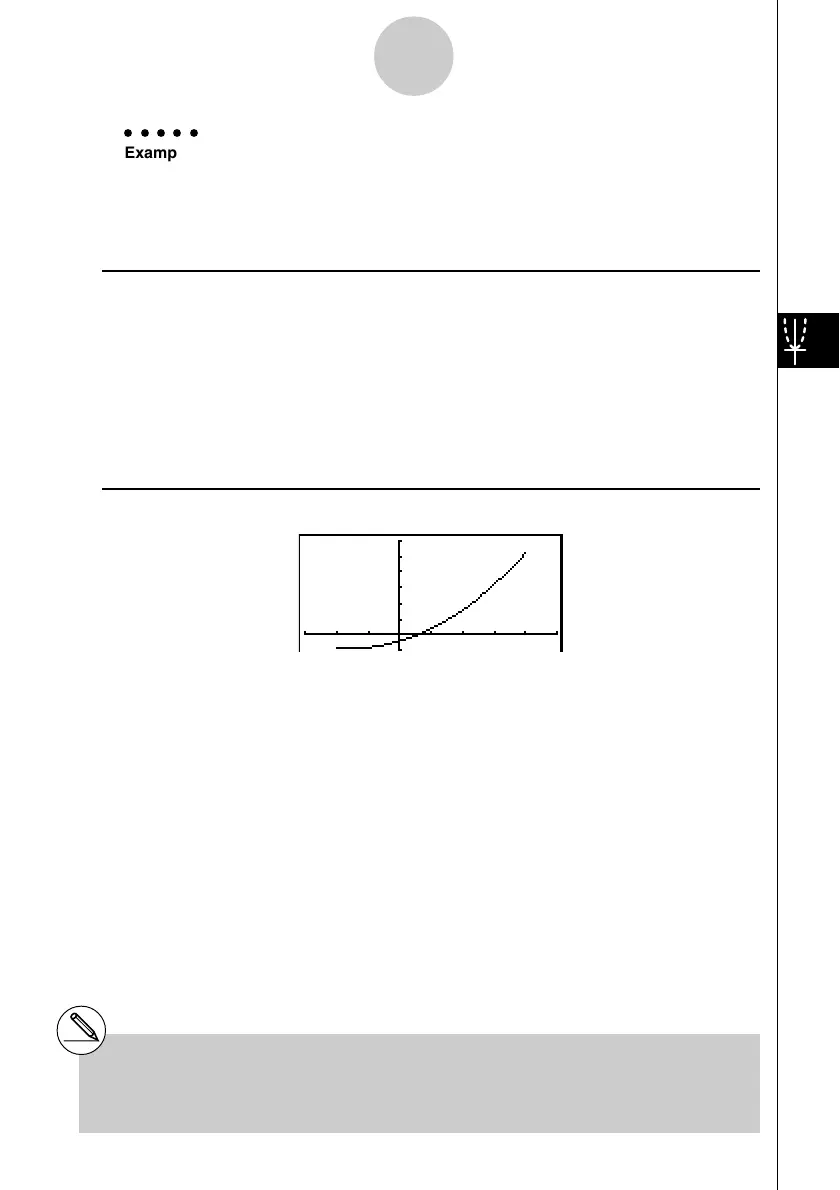
Controlling What Appears on a Graph Screen
○○○○○
Example Graph y = x
2
+ 3x – 2 within the range – 2 < x < 4
Use the following V-Window settings.
Xmin = –3, Xmax = 5, Xscale = 1
Ymin = –10, Ymax = 30, Yscale = 5
Procedure
1 m
GRAPH
2 !3(V-WIN)
-dwfwbwc
-bawdawfwJ
3 3(TYPE)1(Y=)vx+dv-c,
!+( [ )-c,e!-( ] )w
4 6(DRAW)
Result Screen
#You can specify a range when graphing
rectangular expressions, polar expressions,
parametric functions, and inequalities.

 Loading...


