20050401
kk
kk
k Multiple Graphs
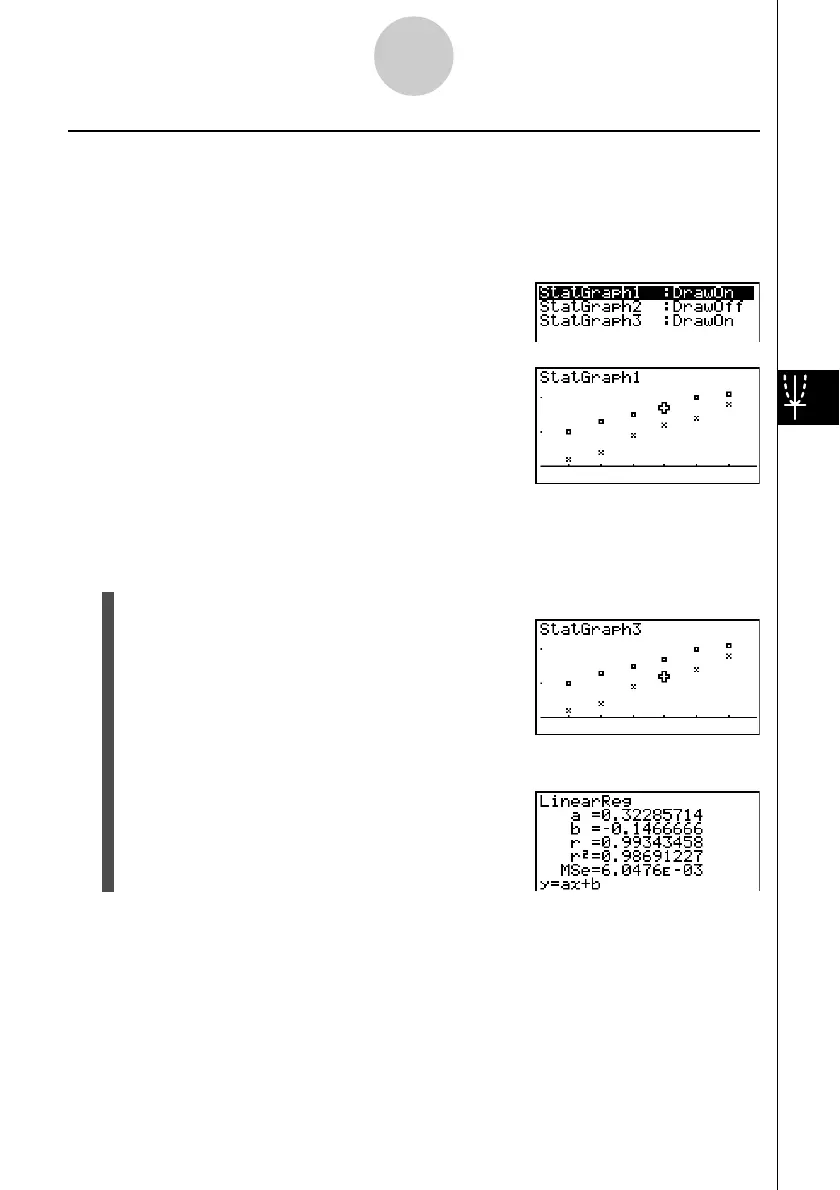
You can draw more than one graph on the same display by using the procedure under
“Changing Graph Parameters” to set the graph draw (On)/non-draw (Off) status of two or all
three of the graphs to draw On, and then pressing 6(DRAW)(see page 6-1-4). After
drawing the graphs, you can select which graph formula to use when performing single-
variable statistic or regression calculations.
1(CALC)
2(X)
• The text at the top of the screen indicates the currently selected graph (StatGraph1 =
Graph 1, StatGraph2 = Graph 2, StatGraph3 = Graph 3).
1. Press c . The graph name at the top of the screen changes when you do.
2. When the graph you want to use is selected, press w.
6-3-12
Calculating and Graphing Paired-Variable Statistical Data

 Loading...


