20050401
k Med-box Graph (MedBox)
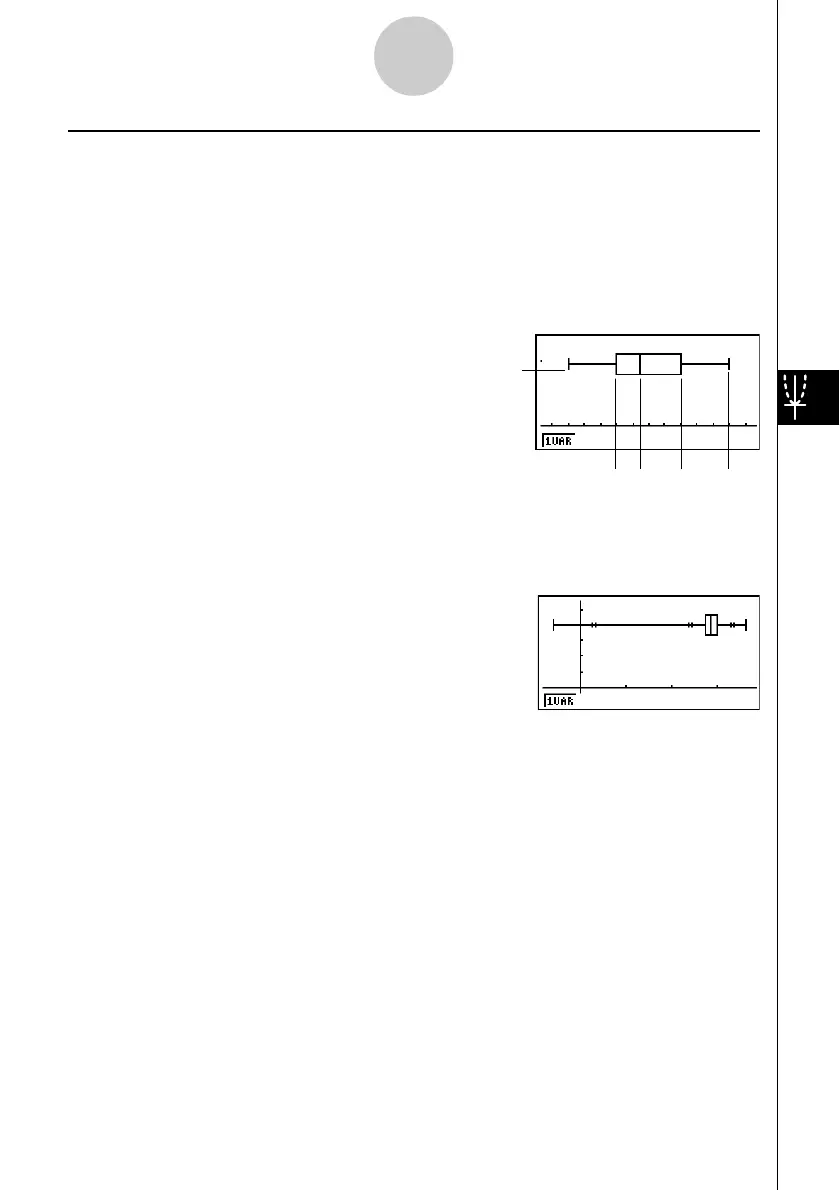
This type of graph lets you see how a large number of data items are grouped within specific
ranges. A box encloses all the data in an area from the first quartile (Q1) to the third quartile
(Q3), with a line drawn at the median (Med). Lines (called whiskers) extend from either end
of the box up to the minimum (minX) and maximum (maxX) of the data.
From the statistical data list, press 1(GRPH) to display the graph menu, press 6(SET),
and then change the graph type of the graph you want to use (GPH1, GPH2, GPH3) to
med-box graph.
To plot the data that falls outside the box, first specify “MedBox” as the Graph Type. Then, on
the same screen you use to specify the graph type, turn the Outliers item “On”, and draw the
graph.
6-2-2
Calculating and Graphing Single-Variable Statistical Data
minX
MedQ1 Q3 maxX

 Loading...


