20050401
9-6-3
Statistical Graphs
kk
kk
k Graphing Statistical Data
The following shows an actual example of how to graph statistical data in the S
•
SHT mode.
It also explains various methods you can use to specify the range of cells that contains the
graph data.
u To graph statistical data
○○○○○
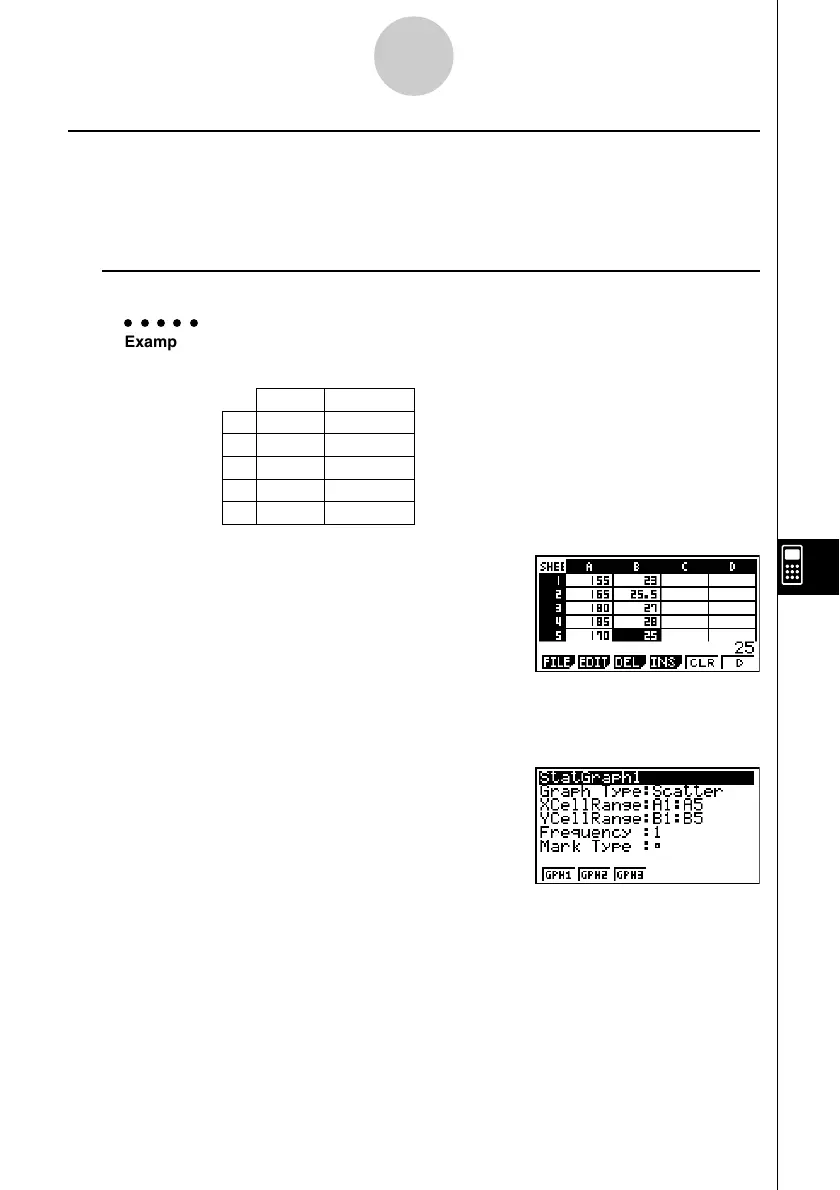
Example: Input the following data into a spreadsheet, and then draw a scatter
diagram.
1. Input the statistical data into a spreadsheet.
•Here, we will input the above data into the
cell range A1:B5.
2. Select the cell ranges you want to graph.
•Here we will select the range A1:B5.
3. Press 6 (g)1(GRPH) to display the GRPH submenu.
4. Press 6 (SET).
• This displays the StatGraph1 settings screen.
The first column of cells you selected in step 2
will be displayed for XCellRange, while the
second column will be displayed for YCellRange.
•You can change the XCellRange and YCellRange settings manually, if you want. For
details, see “Configuring Range Settings for Graph Data Cells” (page 9-6-5).
A 155
B 165
Height
23
25.5
C 180 27
D 185 28
E 170 25
Shoe Size

 Loading...


