20050401
k Regression Calculation
In the explanations from “Linear Regression Graph” to “Logistic Regression Graph,”
regression calculation results were displayed after the graph was drawn. Here, each
coefficient value of the regression line or regression curve is expressed as a number.
You can directly determine the same expression from the data input screen.
Pressing 2(CALC)3(REG) displays a function menu, which contains the following items.
•{X}/{Med}/{X^2}/{X^3}/{X^4}/{Log}/{Exp}/{Pwr}/{Sin}/{Lgst} ...
{linear regression}/{Med-Med}/{quadratic regression}/{cubic regression}/
{quartic regression}/{logarithmic regression}/{exponential regression}/
{power regression}/{sinusoidal regression}/{logistic regression} parameters
○○○○○
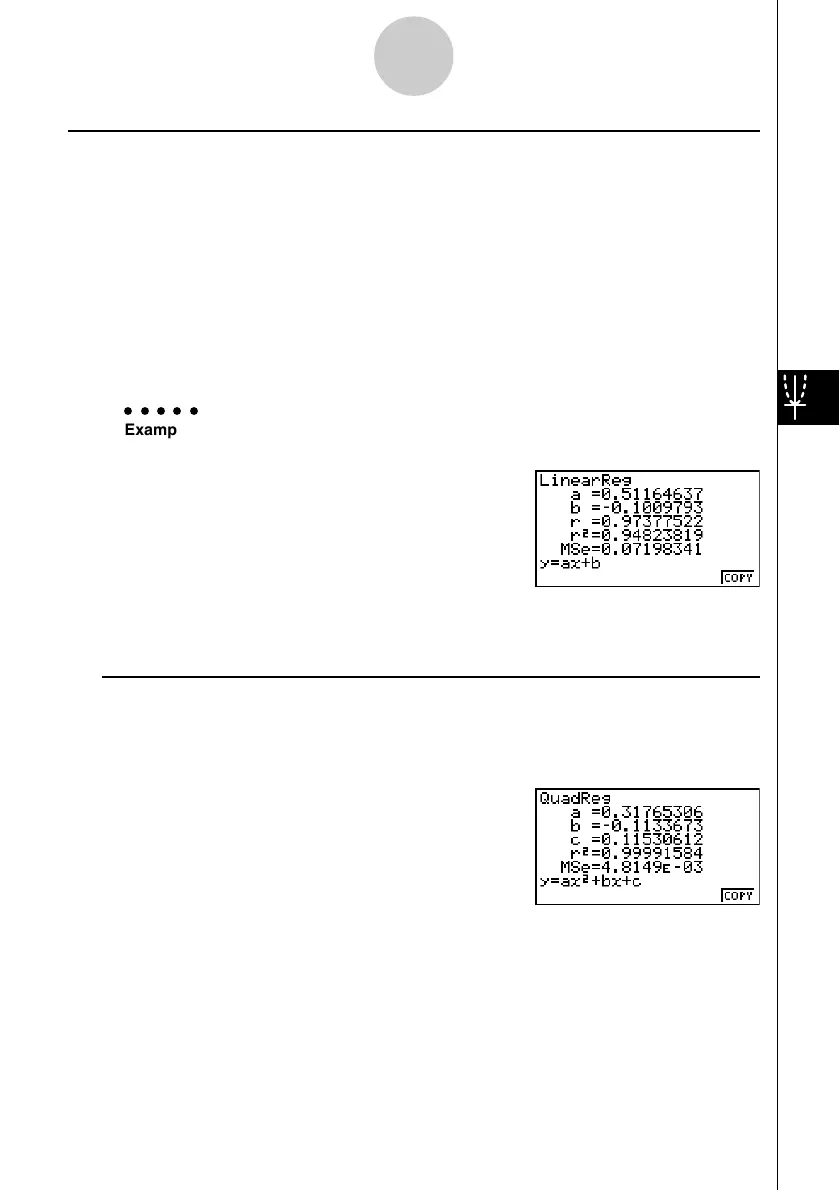
Example To display single-variable regression parameters
2(CALC)3(REG)1(X)
The meanings of the parameters that appear on this screen are the same as those for
“Linear Regression Graph” to “Logistic Regression Graph”.
uu
uu
u Calculation of the Coefficient of Determination (r
2
) and MSe
You can use the STAT mode to calculate the coefficient of determination (r
2
) for quadratic
regression, cubic regression, and quartic regression. The following types of MSe calculations
are also available for each type of regression.
6-4-3
Performing Statistical Calculations

 Loading...


