20050401
k Estimated Value Calculation ( , )
After drawing a regression graph with the STAT mode, you can use the RUN
•
MAT mode to
calculate estimated values for the regression graph’s x and y parameters.
○○○○○
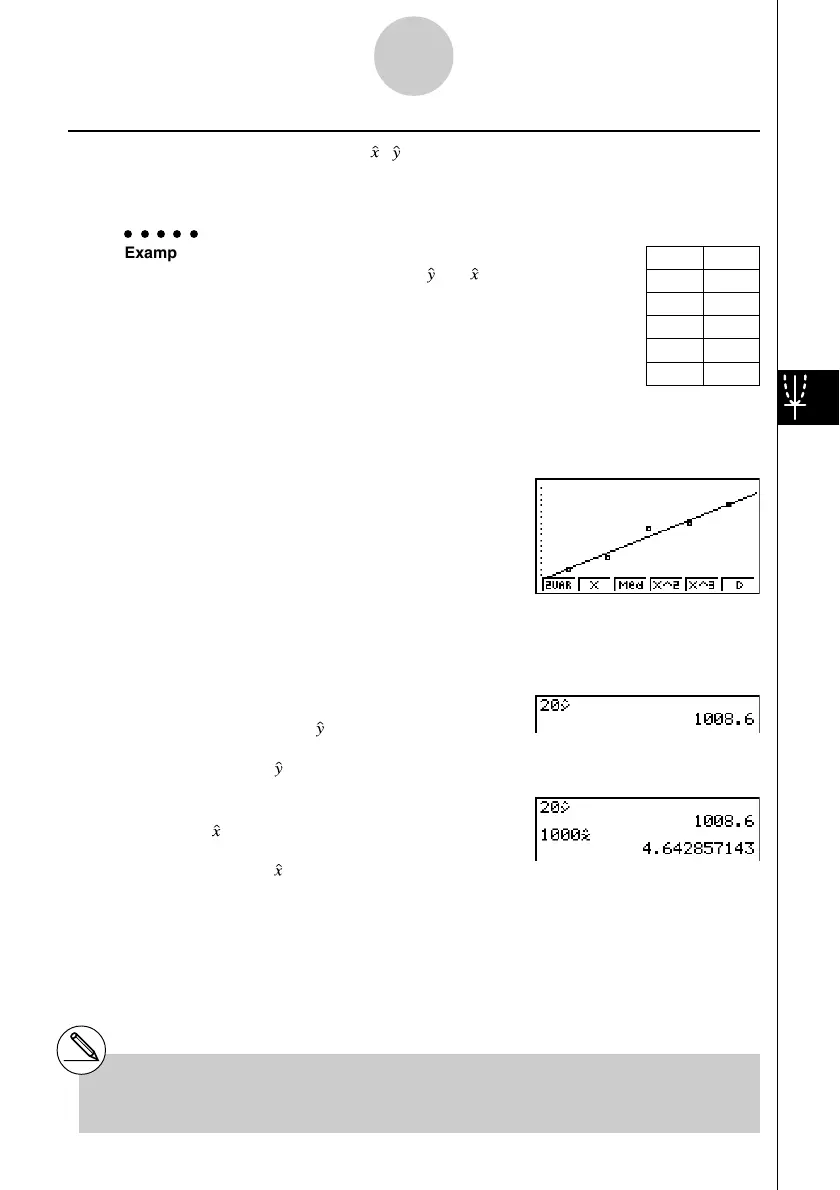
Example To perform a linear regression using the nearby data
and estimate the values of and when xi = 20 and
yi = 1000
1. From the Main Menu, enter the STAT mode.
2. Input data into the list and draw the linear regression graph.
3. From the Main Menu, enter the RUN
•
MAT mode.
4. Press the keys as follows.
ca(value of xi)
K5(STAT)2( )w
The estimated value is displayed for xi = 20.
baaa(value of yi)
1( )w
The estimated value is displayed for yi = 1000.
6-4-6
Performing Statistical Calculations
xi yi
10 1003
15 1005
20 1010
25 1011
30 1014
#You cannot obtain estimated values for a Med-
Med, quadratic regression, cubic regression,
quartic regression, sinusoidal regression, or
logistic regression graph.
 Loading...


