20050401
○○○○○
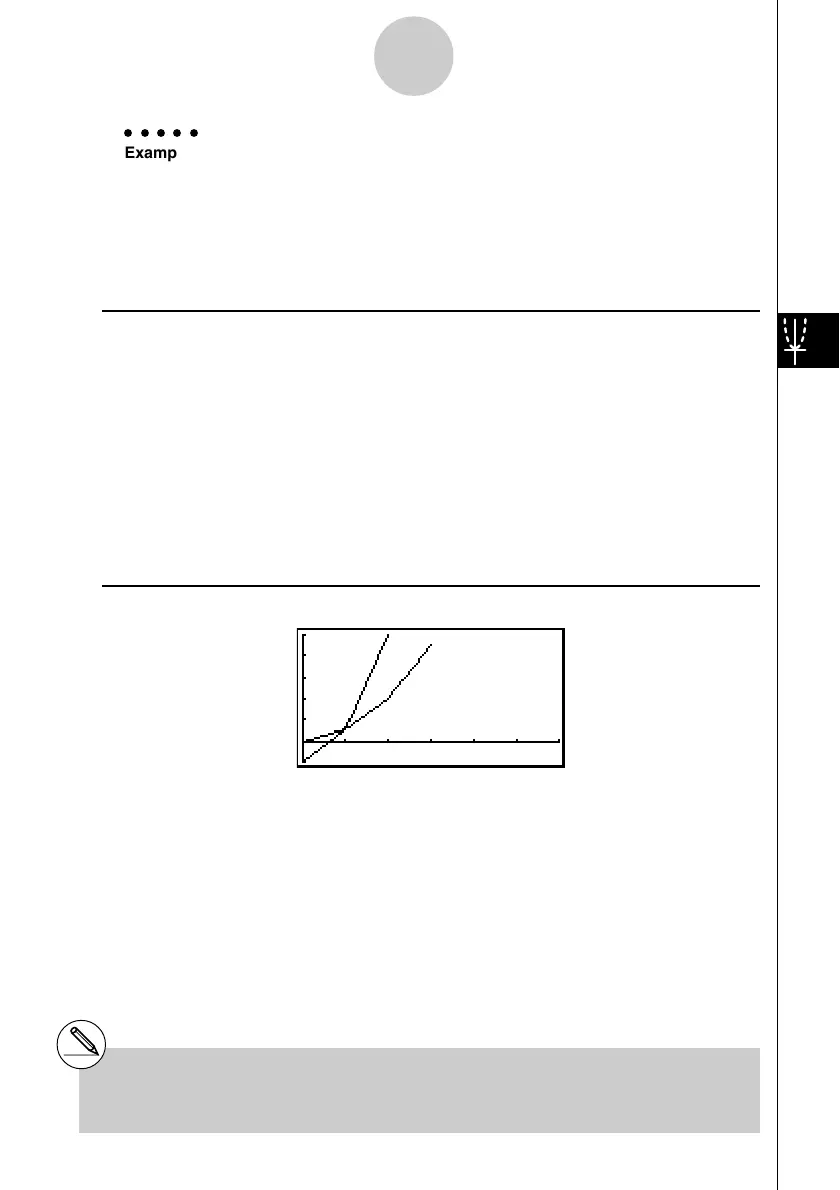
Example Store the two functions below, generate a number table, and then draw
a line graph. Specify a range of –3 to 3, and an increment of 1.
Y1 = 3
x
2
– 2, Y2 = x
2
Use the following V-Window settings.
Xmin = 0, Xmax = 6, Xscale = 1
Ymin = –2, Ymax = 10, Yscale = 2
Procedure
1 m TABLE
2 !3(V-WIN)awgwbwc
-cwbawcwJ
3 3(TYPE)1(Y=) dvx-cw
vxw
4 5(SET)-dwdwbwJ
5 6(TABL)
6 5(G
•
CON)
Result Screen
5-7-10
Using Tables
#You can use Trace, Zoom, or Sketch after
drawing a graph.

 Loading...


