20070201
k How to draw a simple graph (4)
Description
You can specify the graph line style, if you want.
Set Up
1. From the Main Menu, enter the GRAPH mode.
Execution
2. Input the function you want to graph.
Here you would use the V-Window to specify the range and other parameters of the
graph. See 5-2-1.
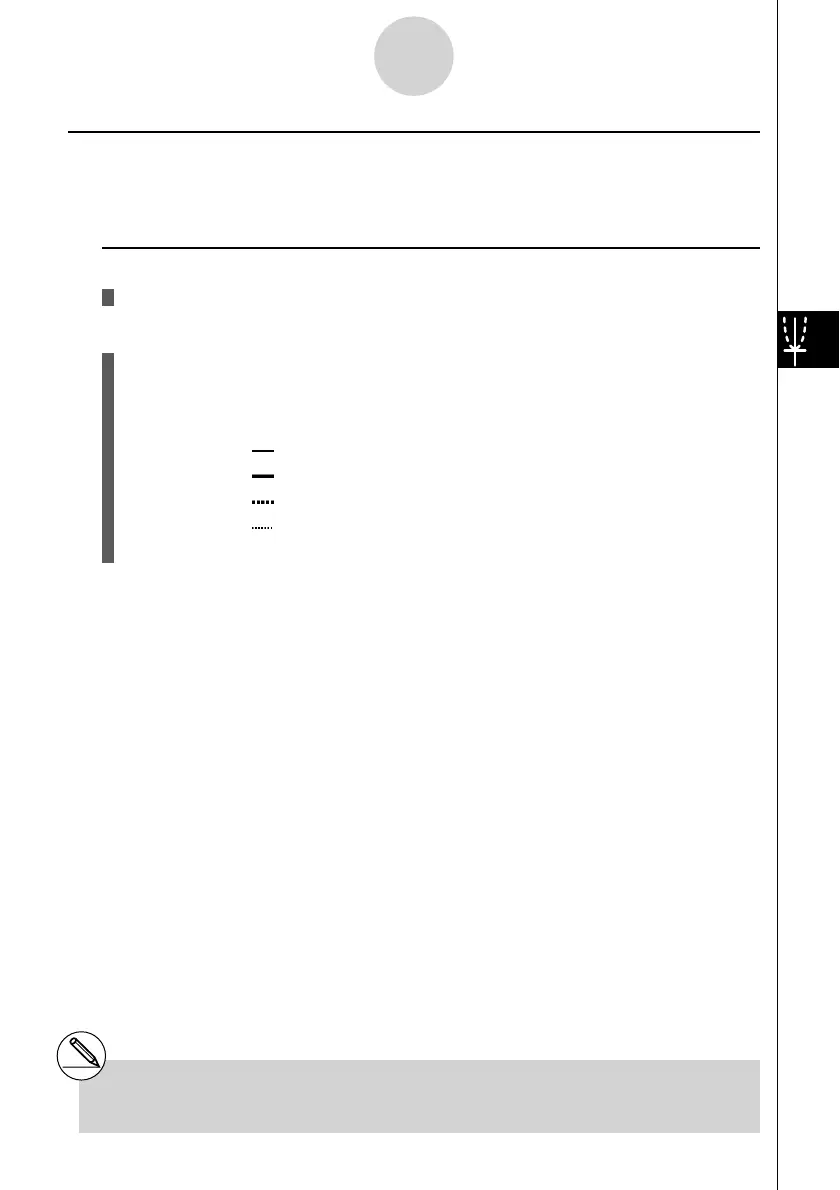
3. Select the line style.
4(STYL) 1(
) … Normal (initial default)
2(
) … Thick (twice the thickness of Normal)
3(
) … Broken (thick broken)
4(
) … Dot (dotted)
4. Draw the graph.
The line style selection is valid only when “Connect” is selected for “Draw Type” on the Setup
screen.
5-1-7
Sample Graphs
# The initial default line setting for an inequality
(Y>, Y<) is dot plot type.
# You can change the graph line style while in the
GRAPH, TABLE or RECUR mode.

 Loading...


