20070201
5-2-10
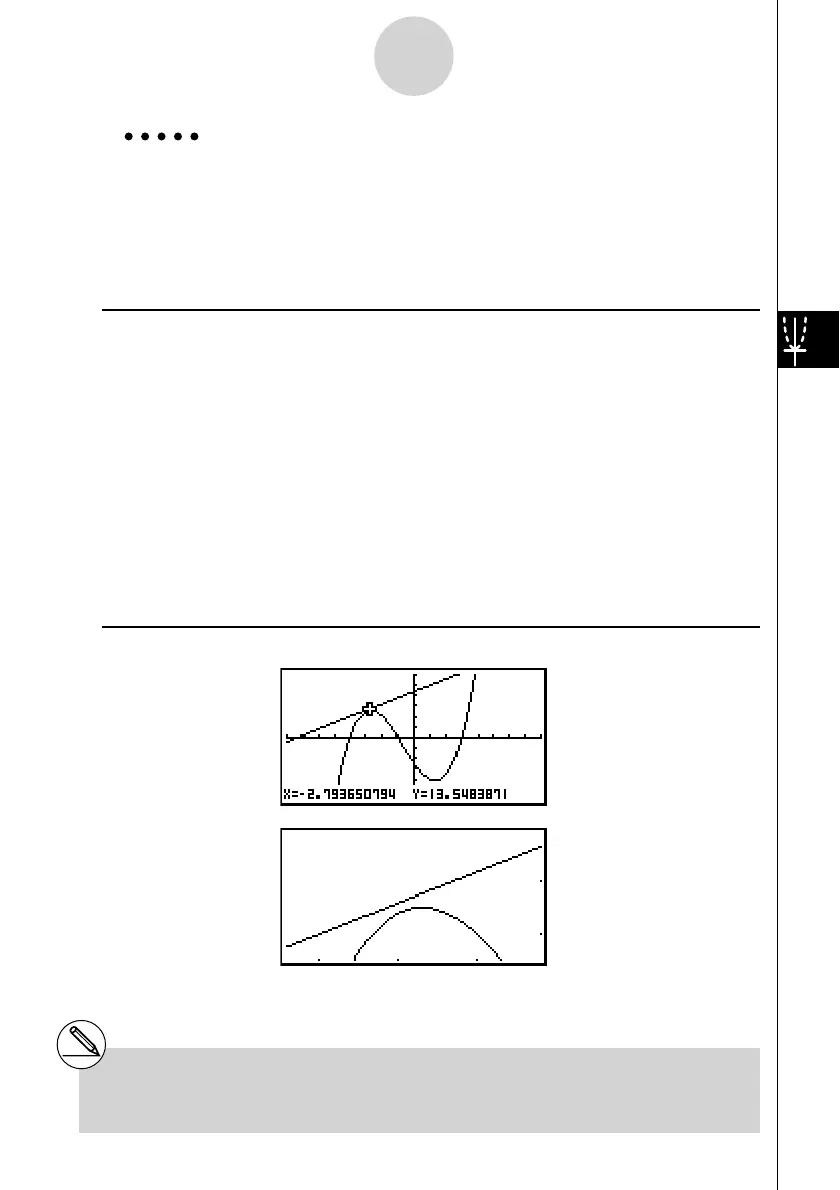
Controlling What Appears on a Graph Screen
Example Enlarge the graphs of the two expressions shown below fi ve times on
both the x - and y -axis to see if they are tangent.
Y1 = (
x + 4)( x + 1)( x – 3), Y2 = 3 x + 22
Use the following V-Window settings.
Xmin = –8, Xmax = 8, Xscale = 1
Ymin = –30, Ymax = 30, Yscale = 5
Procedure
1 m GRAPH
!3(V-WIN) -iwiwbwc
-dawdawfwJ
3(TYPE)1(Y=)(v+e)(v+b)
(v-d)w
dv+ccw
6(DRAW)
2 !2(ZOOM)2(FACT)fwfwJ
3 !2(ZOOM)3(IN)
4 f~f,d~dw
Result Screen
# You can repeat factor zoom to enlarge or
reduce a graph even further.

 Loading...


