20070201
Example Graph
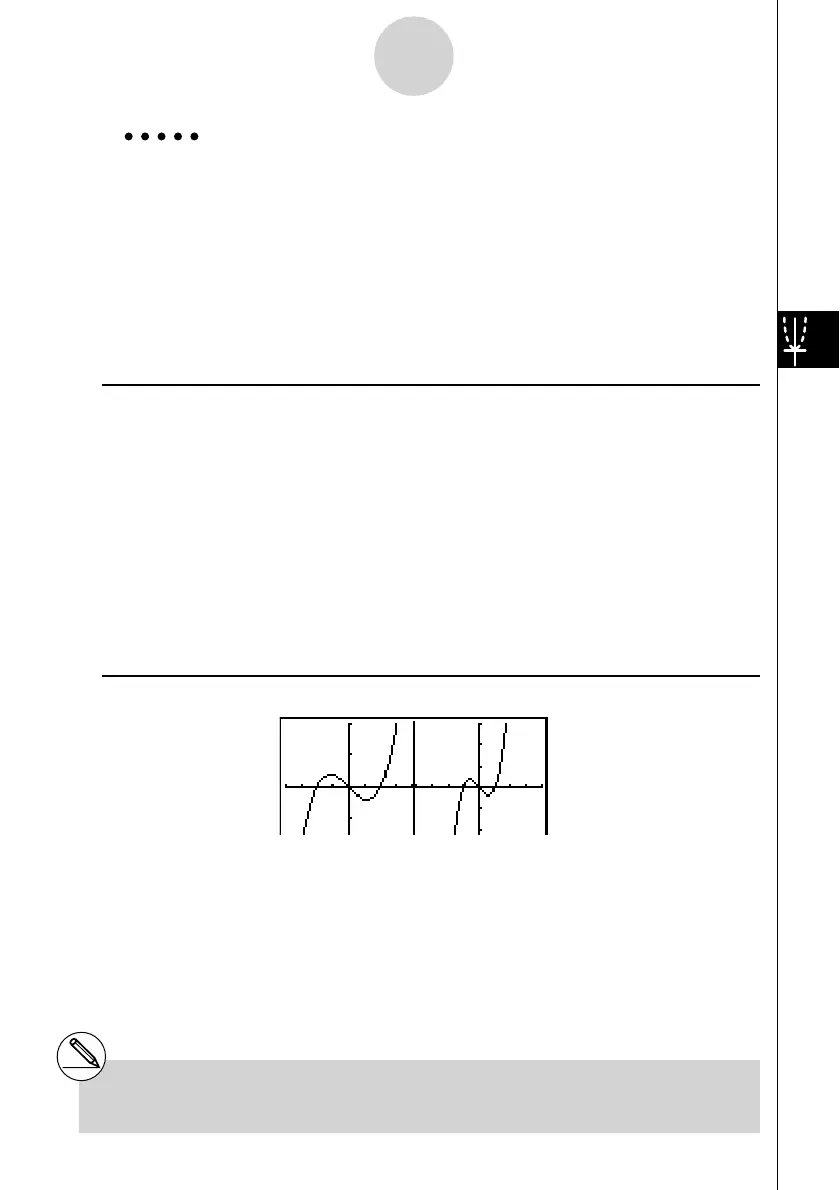
y = x ( x + 1)( x – 1) in the main screen and sub-screen.
Use the following V-Window settings.
(Main Screen)
Xmin = –2, Xmax = 2, Xscale = 0.5
Ymin = –2, Ymax = 2, Yscale = 1
(Sub-screen)
Xmin = –4, Xmax = 4, Xscale = 1
Ymin = –3, Ymax = 3, Yscale = 1
Procedure
1 m GRAPH
2 !m(SET UP)cc1(G+G)J
3 !3(V-WIN) -cwcwa.fwc
-cwcwbw
6(RIGHT) -ewewbwc
-dwdwbwJ
4 3(TYPE)1(Y=)v(v+b)(v-b)w
6(DRAW)
5 K1(COPY)
Result Screen
5-5-2
Drawing Two Graphs on the Same Screen
# Pressing A while a graph is on the display
will return to the screen in step 4.
 Loading...


