20070201
Example Graph
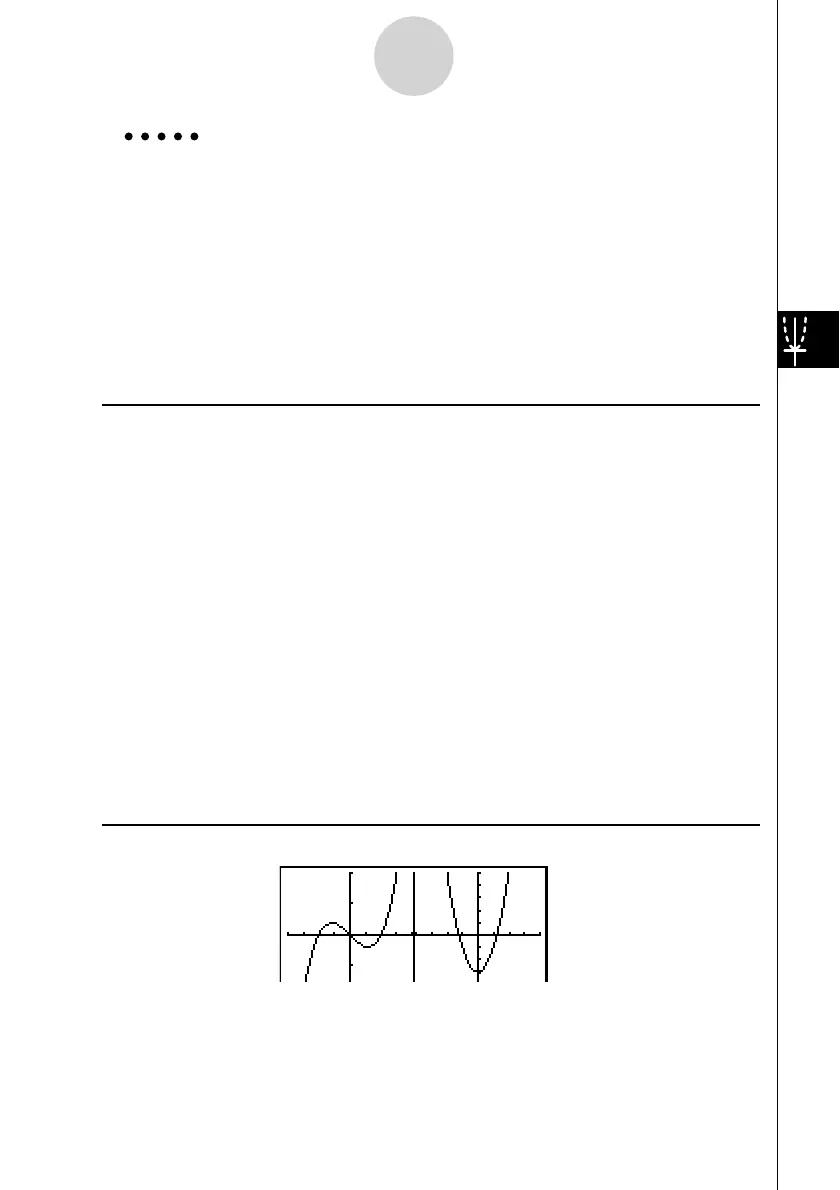
y = x ( x + 1)( x – 1) in the main screen, and y = 2 x
2
– 3 in the sub-
screen.
Use the following V-Window settings.
(Main Screen)
Xmin = –4, Xmax = 4, Xscale = 1
Ymin = –5, Ymax = 5, Yscale = 1
(Sub-screen)
Xmin = –2, Xmax = 2, Xscale = 0.5
Ymin = –2, Ymax = 2, Yscale = 1
Procedure
1 m GRAPH
2 !m(SET UP)cc1(G+G)J
3 !3(V-WIN) -ewewbwc
-fwfwbw
6(RIGHT) -cwcwa.fwc
-cwcwbwJ
4 3(TYPE)1(Y=)v(v+b)(v-b)w
cvx-dw
5 ff1(SEL)
6 6(DRAW)
7 K2(SWAP)
8 A
9 1(SEL)
0 6(DRAW)
Result Screen
5-5-4
Drawing Two Graphs on the Same Screen

 Loading...


