20070201
5-6-6
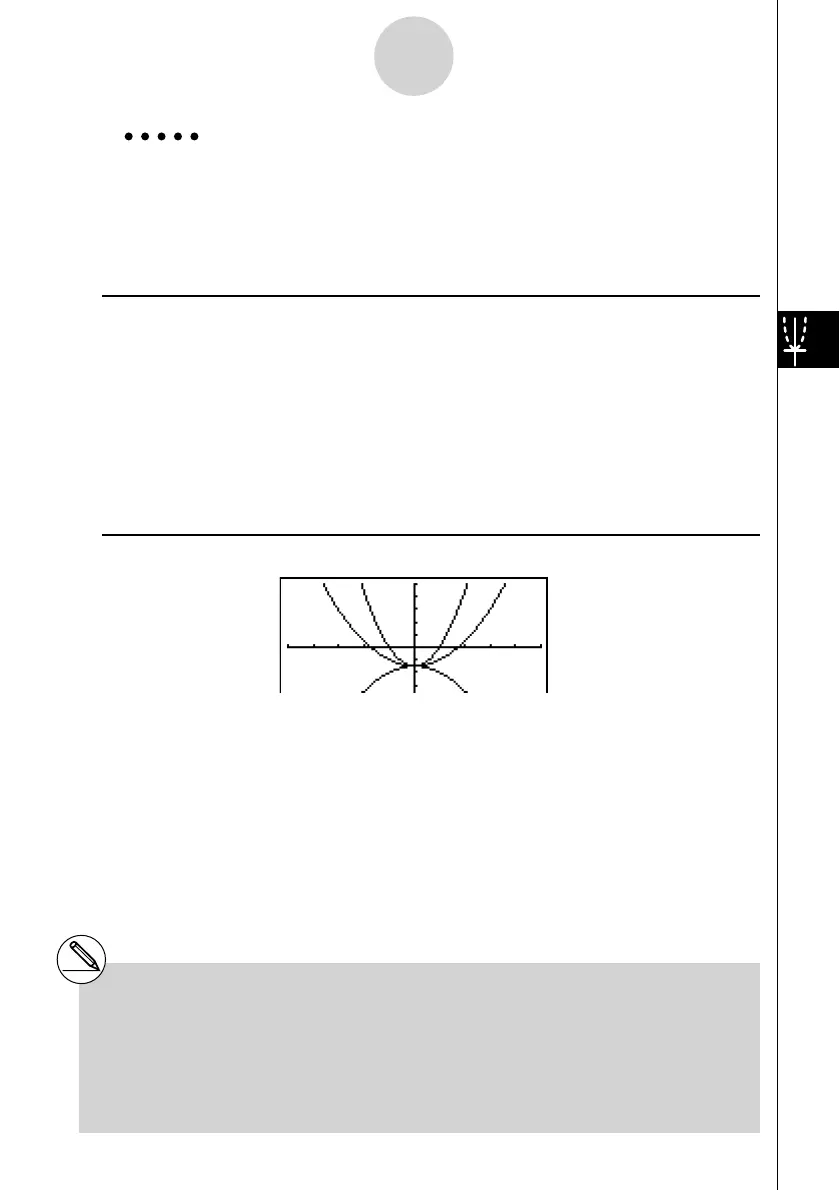
Manual Graphing
Example To graph y = A
x
2
– 3 as the value of A changes in the sequence 3, 1,
–1.
Use the following V-Window settings.
Xmin = –5, Xmax = 5, Xscale = 1
Ymin = –10, Ymax = 10, Yscale = 2
Procedure
1 m GRAPH
2 !m(SET UP)cc3(Off)J
3 !3(V-WIN) -fwfwbwc
-bawbawcwJ
4 3(TYPE)1(Y=)av(A)vx-d,
!+( [ )av(A)!.(=)d,b,-b!-( ] )w
5 6(DRAW)
Result Screen
# The value of only one of the variables in the
expression can change.
# Any of the following cannot be used for the
variable name: X, Y,
r,
θ
, T.
# You cannot assign a variable to the variable
inside the function.
# When Simul Graph is turned on, all of the
graphs for the specifi ed variable values are
drawn simultaneously.
# Overwrite can be used when graphing
rectangular expressions, polar expressions,
parametric functions, X = constant functions,
and inequalities.

 Loading...


