20070201
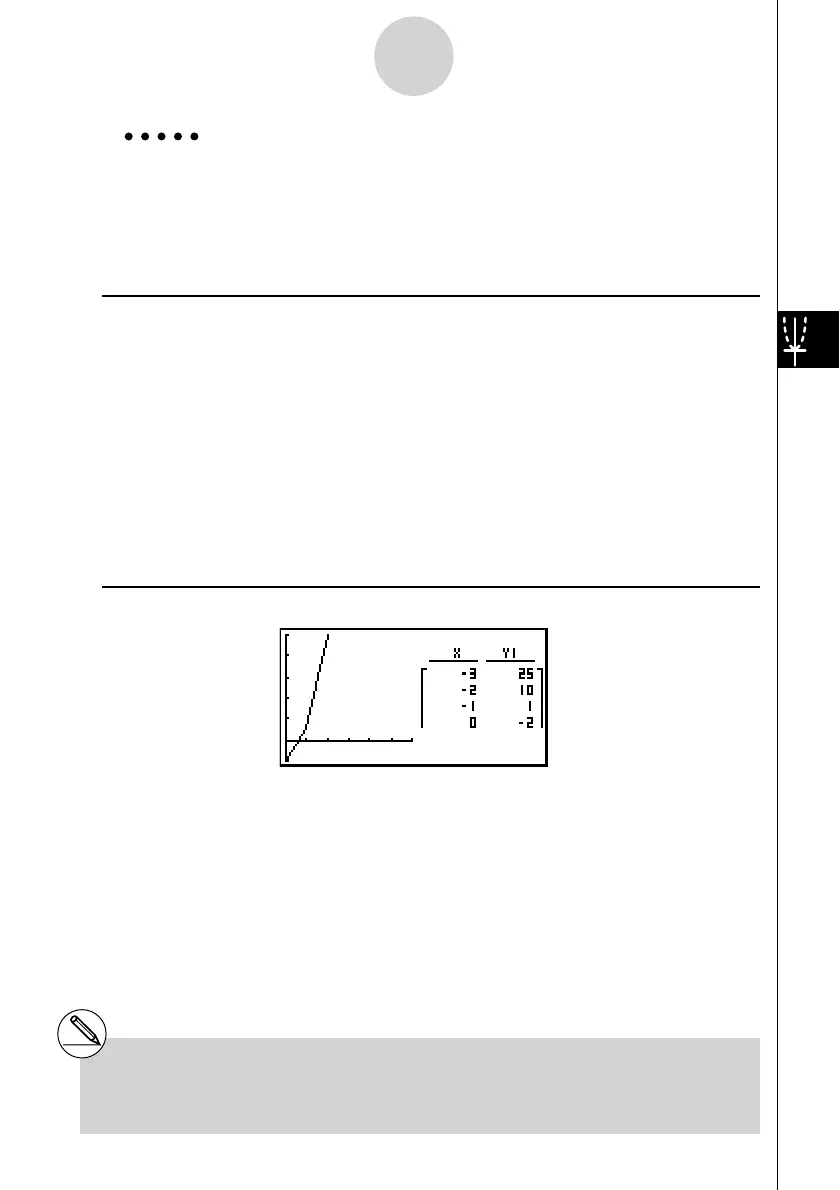
Example Store the function Y1 = 3
x
2
– 2 and simultaneously display its number
table and line graph. Use a table range of –3 to 3 with an increment of 1.
Use the following V-Window settings.
Xmin = 0, Xmax = 6, Xscale = 1
Ymin = –2, Ymax = 10, Yscale = 2
Procedure
1 m TABLE
2 !3(V-WIN) awgwbwc
-cwbawcwJ
3 !m(SET UP)cc1(T+G)J
4 3(TYPE)1(Y=)dvx-cw
5 5(SET)
-dwdwbwJ
6 6(TABL)
7 5(G
• CON)
Result Screen
5-7-14
Using Tables
# You can make the number table active by
pressing K1(CHNG) or A.
# After drawing a graph, you can return to the
number table screen by pressing !6(G ↔ T)
or A.
 Loading...


