20070201
5-7-16
Using Tables
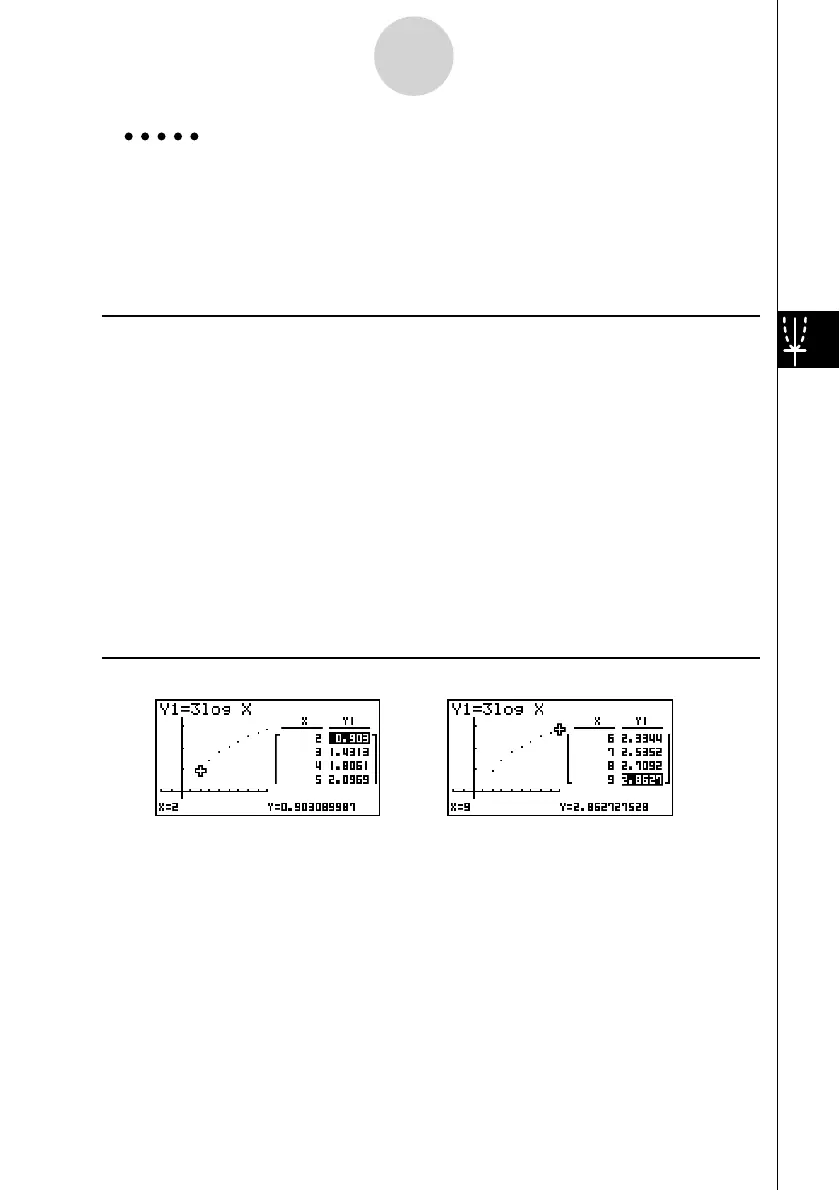
Example Store the function Y1 = 3log
x and simultaneously display its number
table and plot-type graph. Use a table range of 2 through 9, with an
increment of 1.
Use the following V-Window settings.
Xmin = –1, Xmax = 10, Xscale = 1
Ymin = –1, Ymax = 4, Yscale = 1
Procedure
1 m TABLE
2 !3(V-WIN) -bwbawbwc
-bwewbwJ
!m(SET UP)cc1(T+G)J
3 3(TYPE)1(Y=)dlvw
5(SET)
cwjwbwJ
4 6(TABL)
6(G
• PLT)
5 K2(GLINK)
6 c ~ c, f ~ f
Result Screen
…
→
←
…
…
→
←
…
 Loading...


