20070201
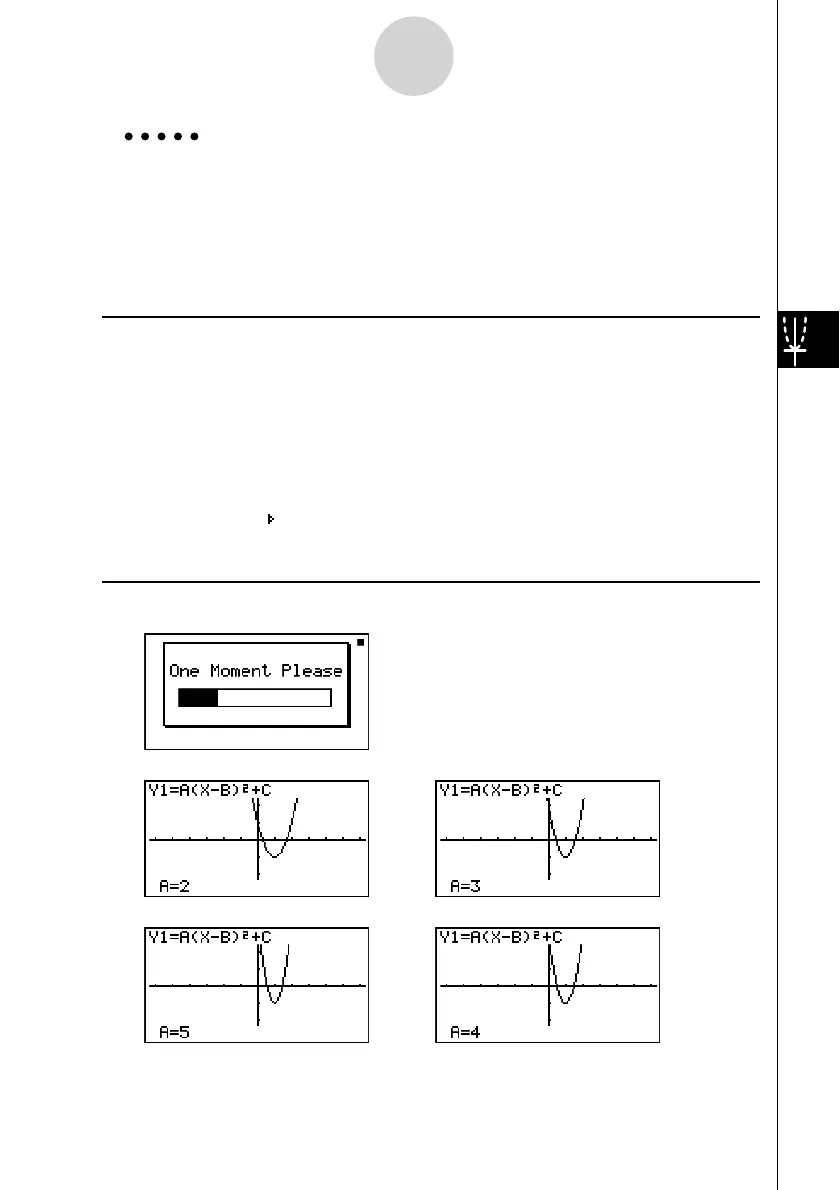
Example Use Dynamic Graph to graph y = A ( x – 1)
2
– 1, in which the value of
coeffi cient A changes from 2 through 5 in increments of 1. The Graph
is drawn 10 times.
Use the following V-Window settings.
Xmin = –6.3, Xmax = 6.3, Xscale = 1
Ymin = –3.1, Ymax = 3.1, Yscale = 1 (initial defaults)
Procedure
1 m DYNA
2 !3(V-WIN)1(INIT)J
3 !m(SET UP)2(Stop)J
4 5(B-IN)c1(SEL)
5 4(VAR)cwbw-bw
6 2(SET)cwfwbwJ
7 3(SPEED)3(
)J
8 6(DYNA)
Result Screen
Repeats from 1 through 4.
1
4
2
3
→
←
→
←
↓
↓ ↑
1
4
2
3
→
←
→
←
↓
↓ ↑
5-8-2
Dynamic Graphing

 Loading...


