20070201
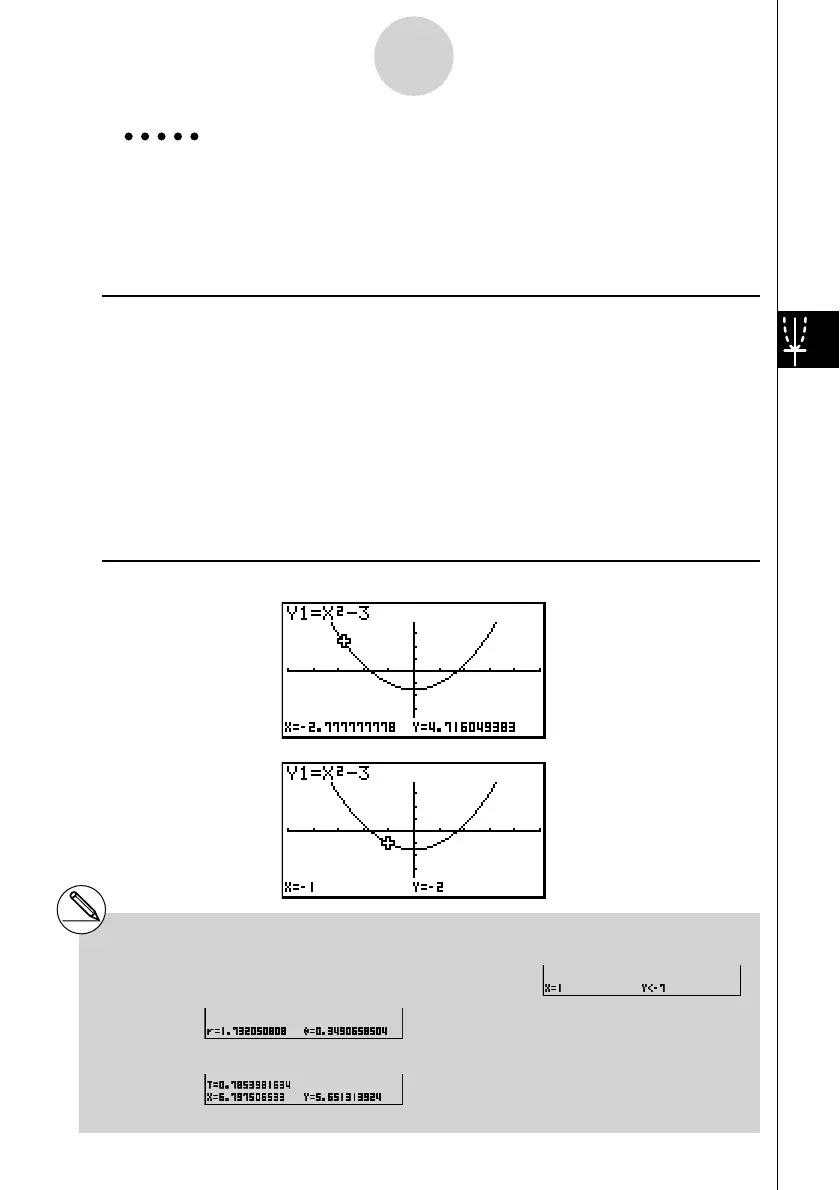
Example Read coordinates along the graph of the function shown below.
Y1 = x
2
– 3
Use the following V-Window settings.
Xmin = –5, Xmax = 5, Xscale = 1
Ymin = –10, Ymax = 10, Yscale = 2
Procedure
1 m GRAPH
2 !3(V-WIN) -fwfwbwc
-bawbawcwJ
3(TYPE)1(Y=)vx-dw
6(DRAW)
3 !1(TRCE)
4 d~d
5 -bw
Result Screen
5-11-2
Function Analysis
# The following shows how coordinates are
displayed for each function type.
• Polar Coordinate Graph
• Parametric Graph
• Inequality Graph
# The pointer will not move if you press the d and
e keys during trace of an “X=c” type graph.

 Loading...


