20070201
20080201
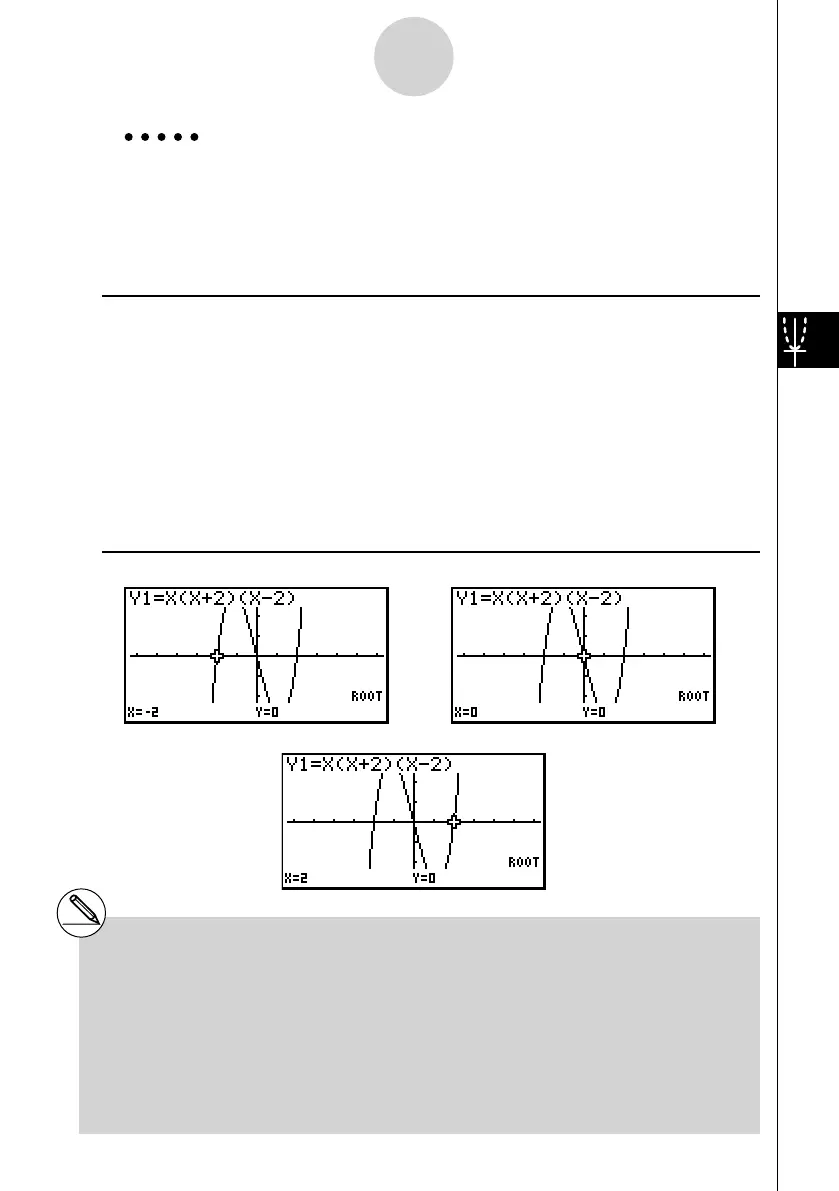
Example Draw the graph shown below and calculate the root for Y1.
Y1 =
x ( x + 2)( x – 2)
Use the following V-Window settings.
Xmin = –6.3, Xmax = 6.3, Xscale = 1
Ymin = –3.1, Ymax = 3.1, Yscale = 1 (initial defaults)
Procedure
1 m GRAPH
2 !3 (V-WIN)1 (INIT)J
3 (TYPE)1 (Y=)v ( v +c)( v -c) w
6 (DRAW)
3 !5 (G-SLV)1 (ROOT)
5 e
e
Result Screen
……
5-11-10
Function Analysis
# When analyzing a single graph, results appear
as soon as you select an analysis function in
step 3, so step 4 is not necessary.
# Root, local maximum value, local minimum
value, and
y -intercept can be calculated for
rectangular coordinate graphs and inequality
graphs only.
# Graph analysis is not possible for the graph
whose function is the format X = constant.
# The
y -intercept is the point where the graph
crosses the y -axis.
# Either of the following can cause poor accuracy or
even make it impossible to obtain solutions.
• When the graph of the solution obtained is a
point of tangency with the x-axis
• When a solution is an infl ection point

 Loading...


