20070201
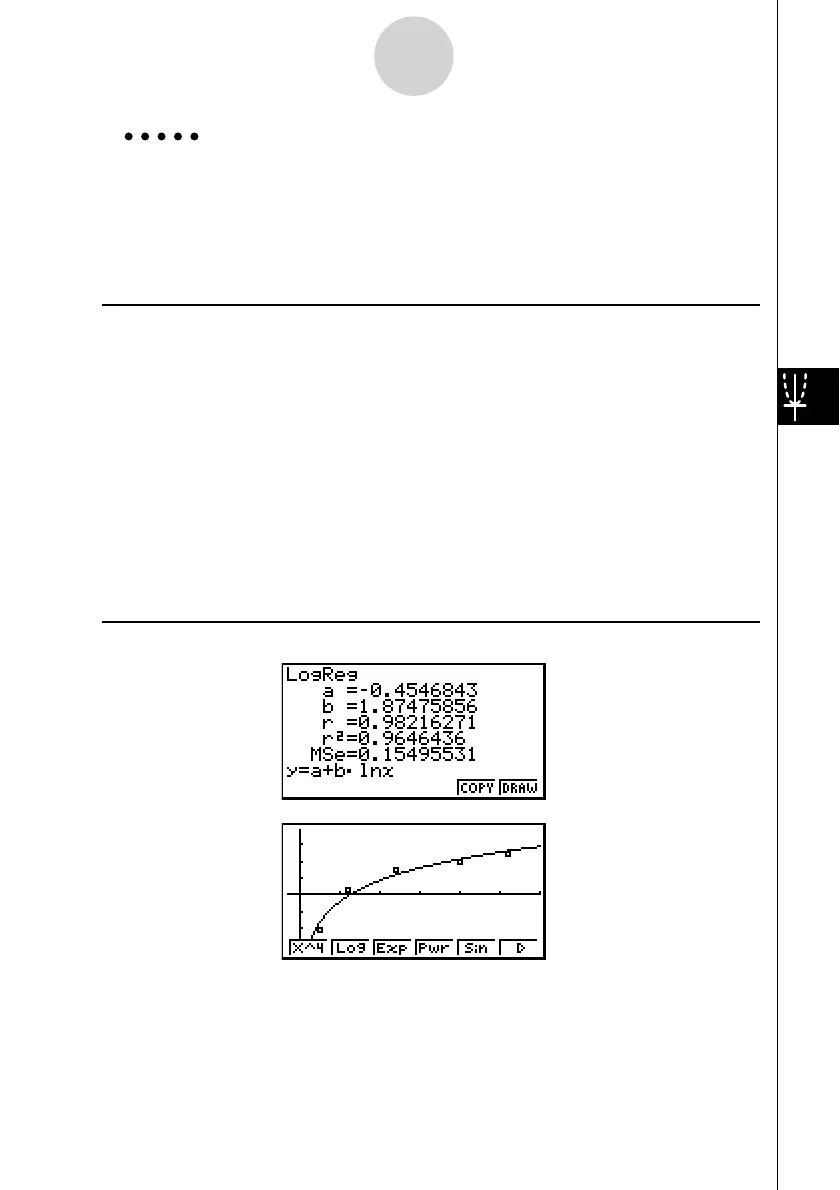
Example Input the two sets of data shown below and plot the data on a scatter
diagram. Next, perform logarithmic regression on the data to display
the regression parameters, and then draw the corresponding
regression graph.
0.5, 1.2, 2.4, 4.0, 5.2 ( x List)
–2.1, 0.3, 1.5, 2.0, 2.4 ( y List)
Procedure
1 m STAT
2 a.fwb.cw
c.ewewf.cw
e
-c.bwa.dw
b.fwcwc.ew
1(GRPH)6(SET)c1(Scat)J
1(GPH1)
3 1(CALC)6(g)2(Log)
4 6(DRAW)
Result Screen
6-3-4
Calculating and Graphing Paired-Variable Statistical Data
 Loading...


