5-24
Pressing 1(SELECT) while one of the functions marked “
R
” or “
B
” is highlighted would
causes its “
R
” or “
B
” indicator to be cleared. A function without an indicator is drawn as
the main screen graph (on the left side of the display).
• The graph properties operation can be performed only for the graph that is on the left side
of the Dual Graph graph screen.
• If you change the graph properties of an expression marked with “
B
” on the graph
relation list screen and then draw the graph, the changes will be applied to both graphs.
• You cannot change the graph properties of an expression marked with “
R
” on the graph
relation list screen.
• For details about how to change graph properties, see “Changing Graph Properties” (page
5-15).
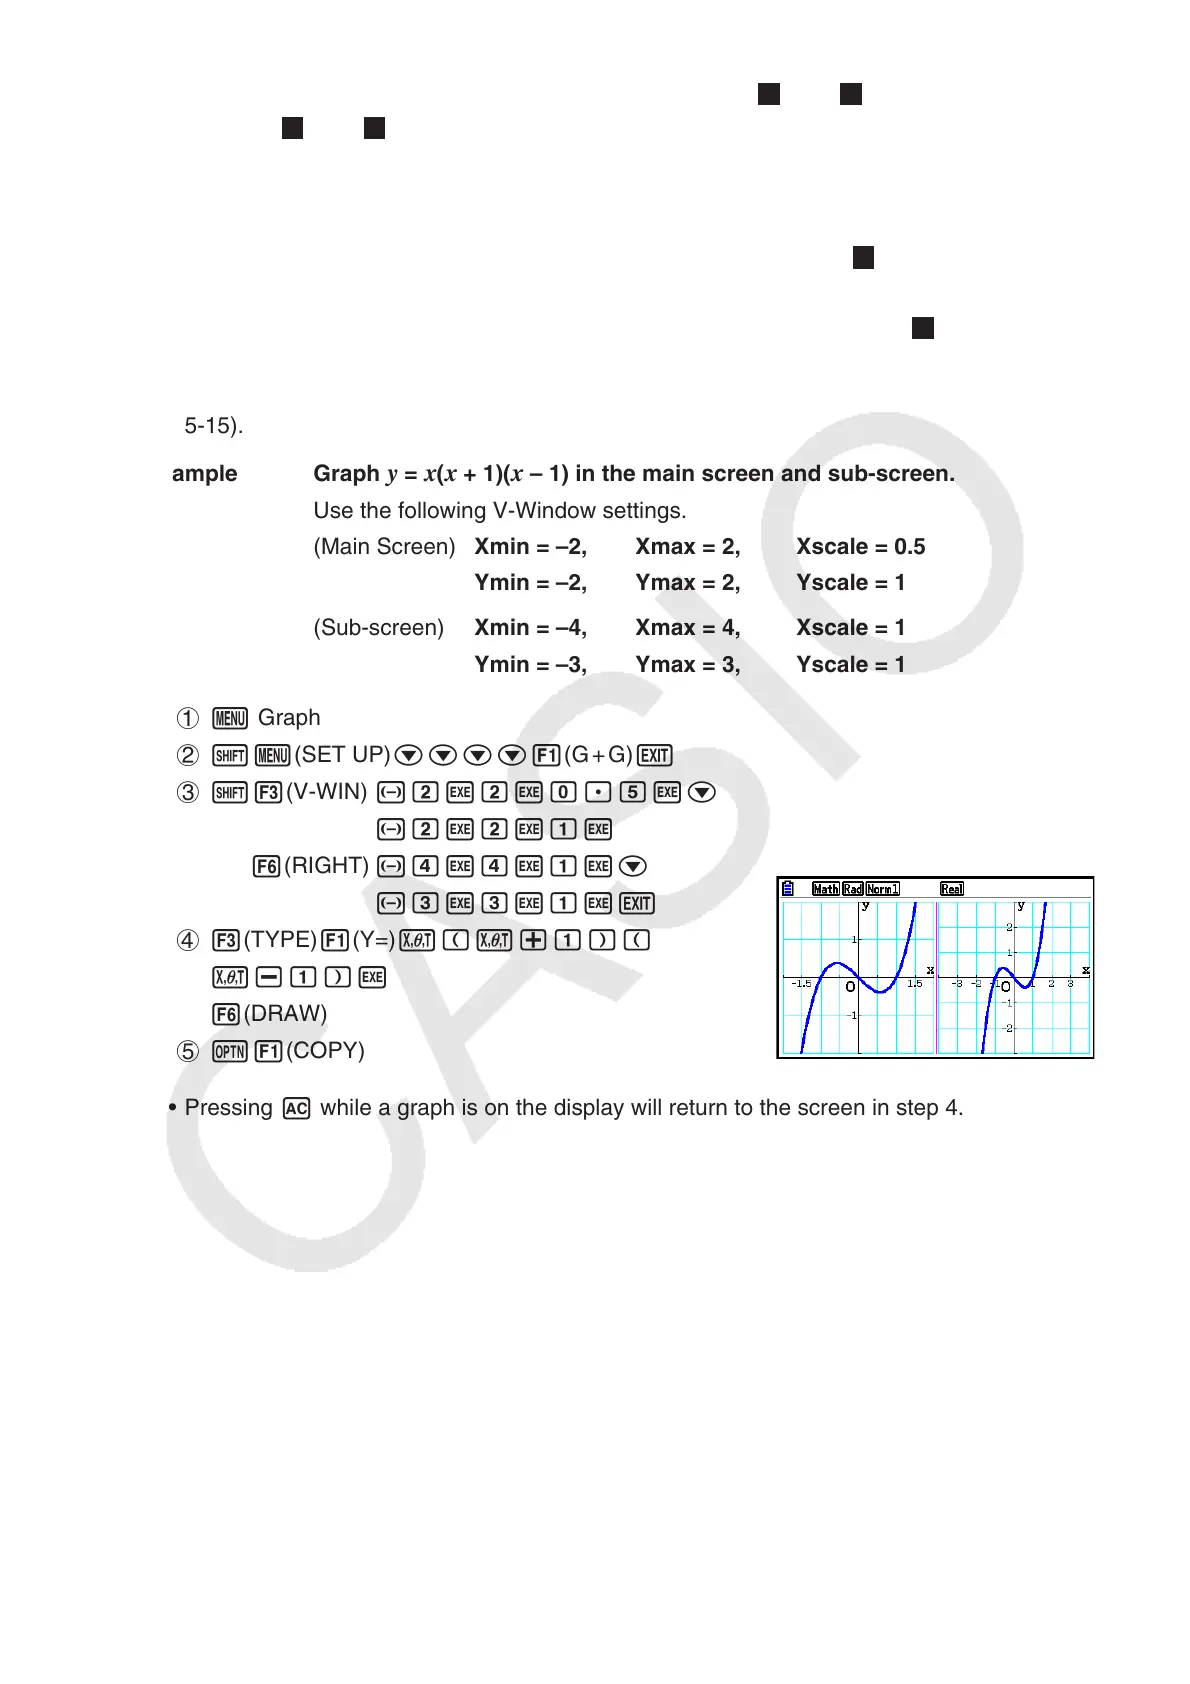
Example Graph
y = x(x + 1)(x – 1) in the main screen and sub-screen.
Use the following V-Window settings.
(Main Screen) Xmin = –2, Xmax = 2, Xscale = 0.5
Ymin = –2, Ymax = 2, Yscale = 1
(Sub-screen) Xmin = –4, Xmax = 4, Xscale = 1
Ymin = –3, Ymax = 3, Yscale = 1
1 m Graph
2 !m(SET UP)cccc1(G + G)J
3 !3(V-WIN) -cwcwa.fwc
-cwcwbw
6(RIGHT) -ewewbwc
-dwdwbwJ
4 3(TYPE) 1(Y=) v(v+b)(
v-b)w
6(DRAW)
5 K1(COPY)
• Pressing A while a graph is on the display will return to the screen in step 4.