5-56
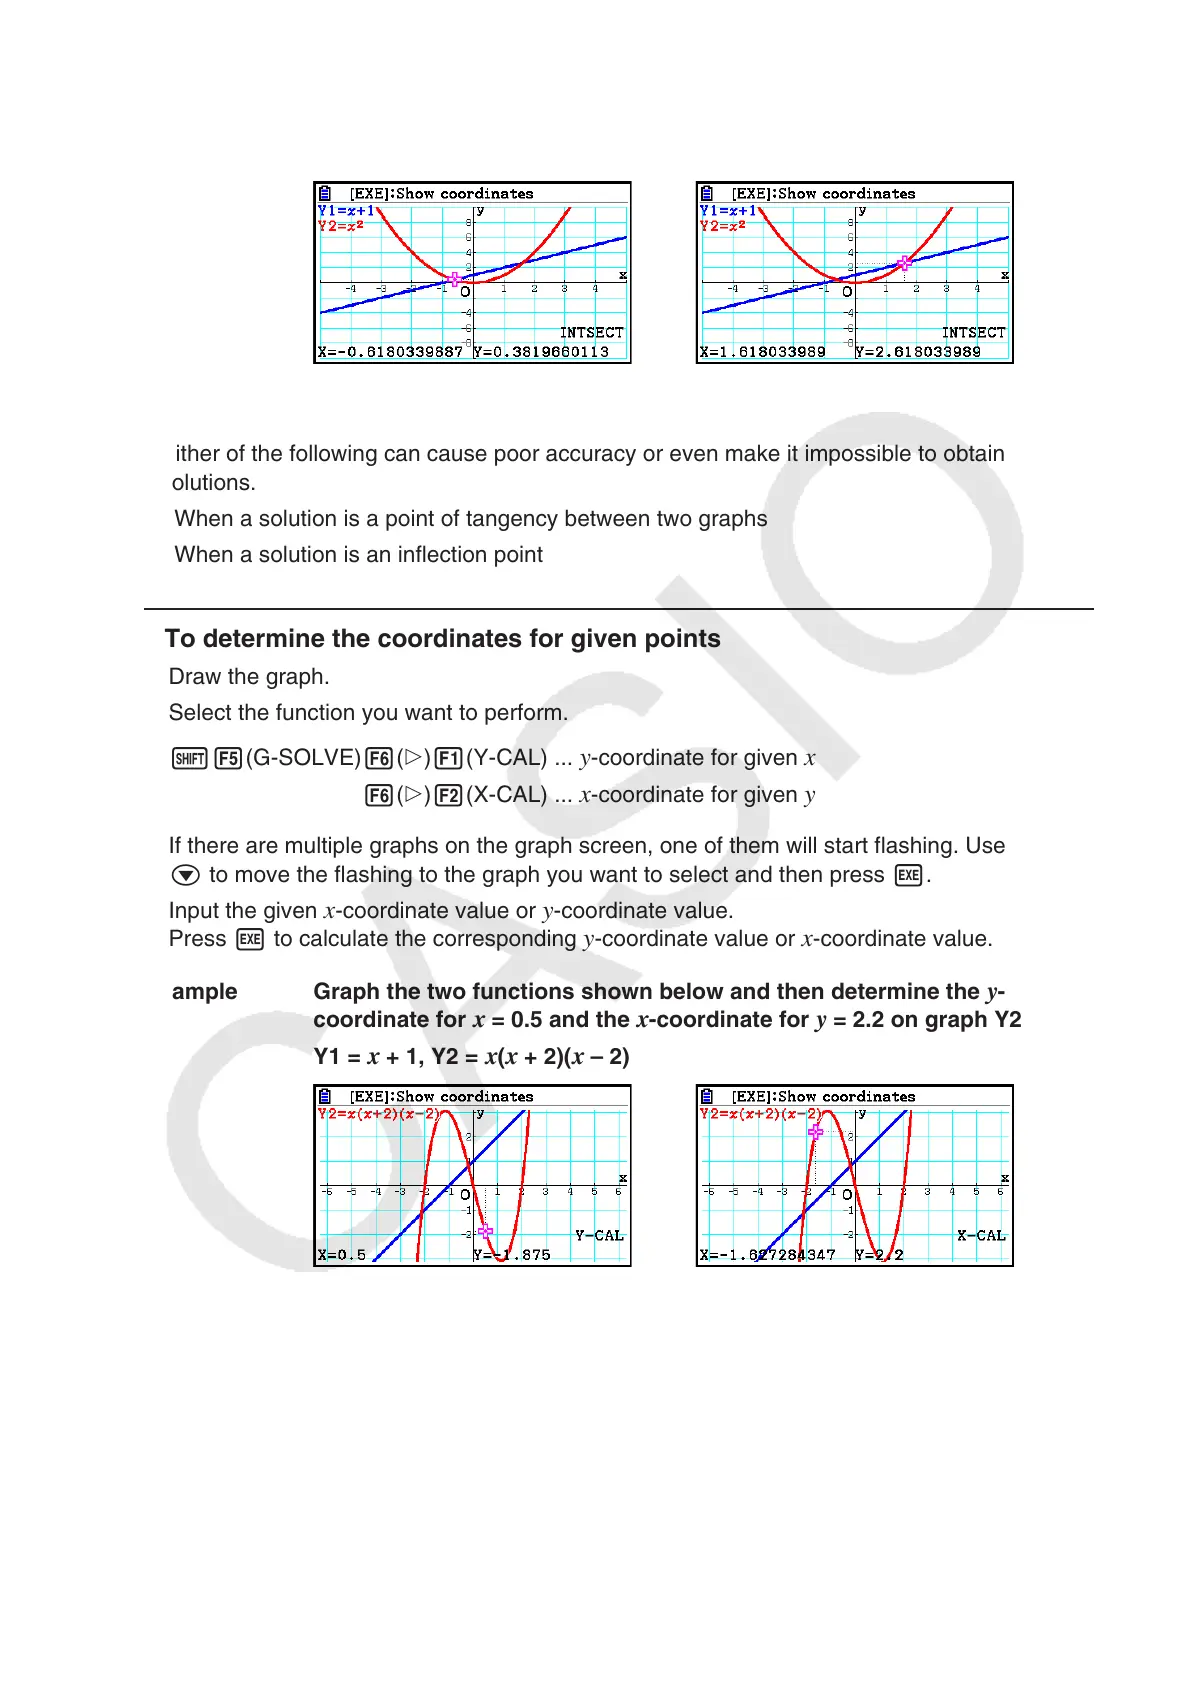
Example Graph the two functions shown below, and determine the point of
intersection between Y1 and Y2.
Y1 =
x + 1, Y2 = x
2
• You can calculate the point of intersection for rectangular coordinate graphs (Y=
f ( x ) type)
and inequality graphs (Y > f(x), Y < f(x), Y ≥ f(x) or Y ≤ f(x)) only.
• Either of the following can cause poor accuracy or even make it impossible to obtain
solutions.
- When a solution is a point of tangency between two graphs
- When a solution is an inflection point
u To determine the coordinates for given points
1. Draw the graph.
2. Select the function you want to perform.
!5(G-SOLVE) 6(g)1(Y-CAL) ...
y-coordinate for given x
6(g)2(X-CAL) ... x-coordinate for given y
3. If there are multiple graphs on the graph screen, one of them will start flashing. Use f and
c to move the flashing to the graph you want to select and then press w.
4. Input the given
x-coordinate value or y-coordinate value.
Press w to calculate the corresponding y-coordinate value or x-coordinate value.
Example Graph the two functions shown below and then determine the
y -
coordinate for x = 0.5 and the x -coordinate for y = 2.2 on graph Y2.
Y1 =
x + 1, Y2 = x ( x + 2)( x – 2)
• When there are multiple results for the above procedure, press e to calculate the next
value. Pressing d returns to the previous value.
• The X-CAL value cannot be obtained for a parametric function graph.