6-26
u Regression Formula Copy Function from a Regression Calculation Result
Screen
In addition to the normal regression formula copy function that lets you copy the regression
calculation result screen after drawing a statistical graph (such as Scatter Plot), the Statistics
mode also has a function that lets you copy the regression formula obtained as the result of a
regression calculation. To copy a resulting regression formula, press 6(COPY).
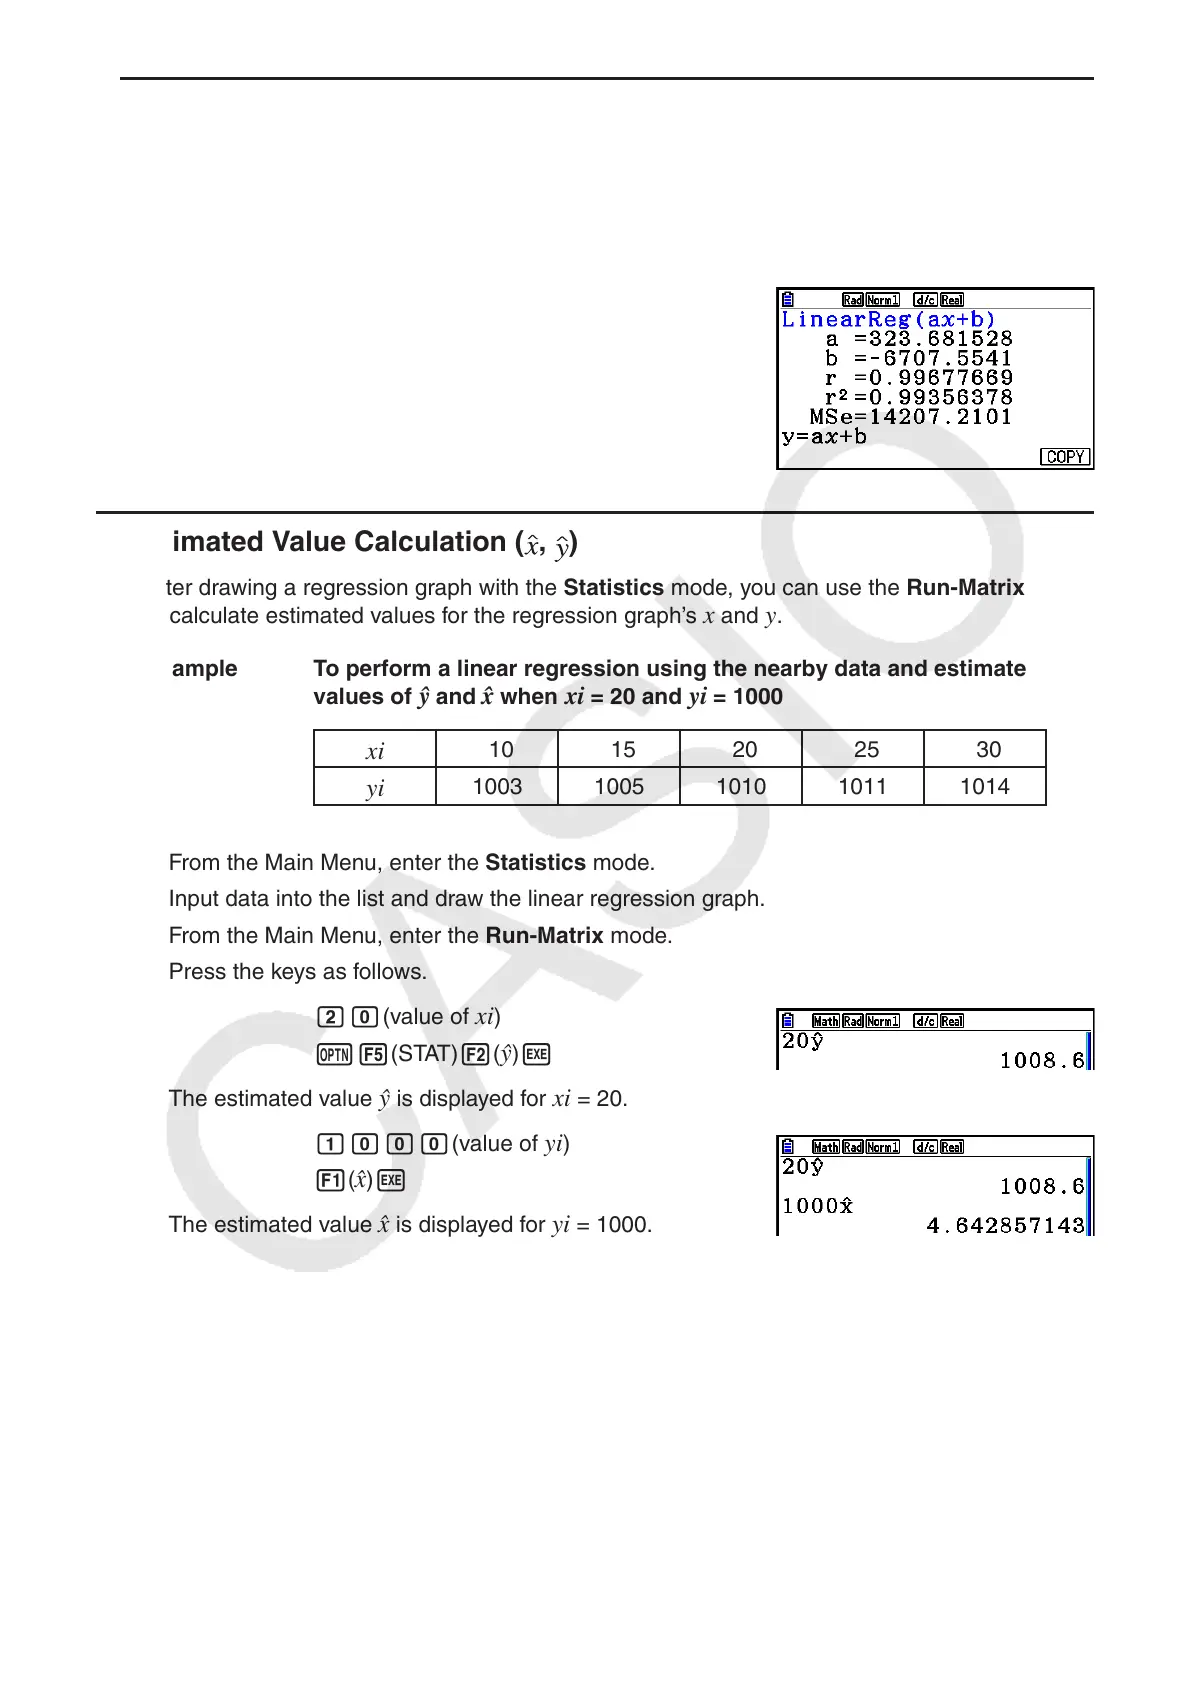
k Estimated Value Calculation ( , )
After drawing a regression graph with the Statistics mode, you can use the Run-Matrix mode
to calculate estimated values for the regression graph’s x and y .
Example To perform a linear regression using the nearby data and estimate the
values of
and x when xi = 20 and yi = 1000
xi
10 15 20 25 30
yi
1003 1005 1010 1011 1014
1. From the Main Menu, enter the Statistics mode.
2. Input data into the list and draw the linear regression graph.
3. From the Main Menu, enter the Run-Matrix mode.
4. Press the keys as follows.
ca(value of xi )
K5(STAT) 2(
) w
The estimated value is displayed for xi = 20.
baaa(value of yi )
1(
ˆ x ) w
The estimated value ˆ x is displayed for yi = 1000.
• You cannot obtain estimated values for a Med-Med, quadratic regression, cubic regression,
quartic regression, sinusoidal regression, or logistic regression graph.