8-36
When “MedBox” is specified for the Graph Type:
• Outliers On/Off setting
• Box color setting (one of the seven colors*)
• Whisker color setting (one of the seven colors*)
• Outliers color setting (one of the seven colors*)
• Box inside color setting (one of the seven colors* or ColorAuto)
• Box inside paint setting (ColorNormal, ColorLighter)
When “Bar” is specified for the Graph Type:
• First bar graph data (list name)
• Second and third bar graph data (list name)
• Bar graph orientation (Length or Horizontal)
• Area color settings for each data (one of the seven colors* or ColorAuto)
• Paint style settings for each data (ColorNormal, ColorLighter)
• Border color settings for each data (one of the seven colors* or ColorClr)
* Black, Blue, Red, Magenta, Green, Cyan, Yellow
The graph conditions that are required depends on the graph type. See “General Graph
Settings” (page 6-2).
• The following is a typical graph condition specification for a scatter diagram or
xyLine graph.
S-Gph1 DrawOn, Scatter, List 1, List 2, 1, Square, ColorLinkOff, ColorAuto
In the case of an
xy line graph, replace “Scatter” in the above specification with “xyLine”.
• The following is a typical graph condition specification for a normal probability plot.
S-Gph1 DrawOn, NPPlot, List 1, Square, ColorLinkOff, Blue
• The following is a typical graph condition specification for a histogram.
S-Gph1 DrawOn, Hist, List 1, List 2, ColorLinkOff, Blue ColorLighter
• The following is a typical graph condition specification for a broken graph.
S-Gph1 DrawOn, Broken, List 1, List 2, ColorLinkOff, Blue
• The following is a typical graph condition specification for a normal distribution graph.
S-Gph1 DrawOn, N-Dist, List 1, List 2, Blue
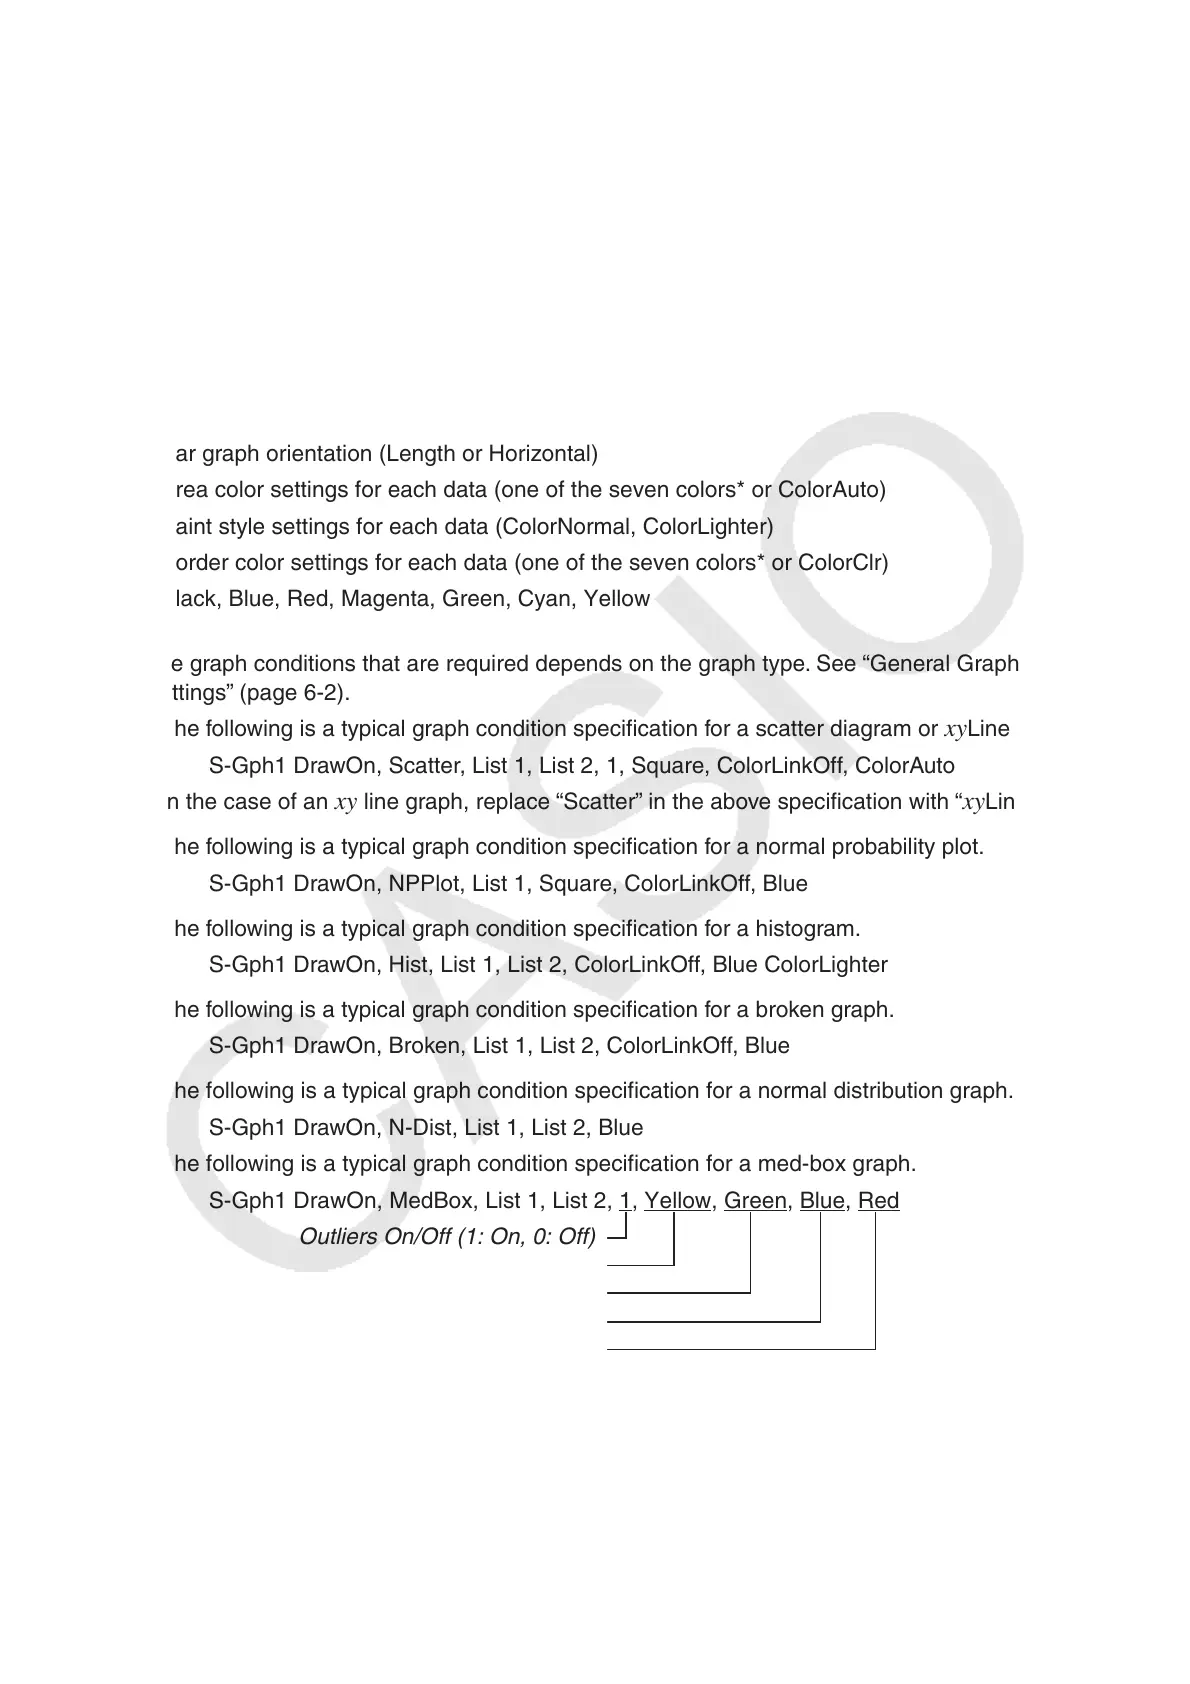
• The following is a typical graph condition specification for a med-box graph.
S-Gph1 DrawOn, MedBox, List 1, List 2, 1, Yellow, Green, Blue, Red
Outliers On/Off (1: On, 0: Off)
Outliers color
Box color
Whisker color
Box inside color