2010080120100801
ε-43
Graph Analysis Tool Graph Screen Operations
5. After everything is the way you want, press w.
• This saves the lists and the message “Complete!” appears. Press w to return to the
graph screen.
• For details about using list data, see Chapter 3 of this manual.
Note
• Pressing 1(All) in place of 2(SELECT) in step 2 converts the entire graph to list data. In
this case, the “Store Sample Data” dialog box appears as soon as you press 1(All).
k Using Fourier Series Expansion to Transform a Waveform to a
Function
Fourier series expansion is effective for studying sounds by expressing them as functions.
The procedure below assumes that there is a graph of sampled sound data already on the
graph screen.
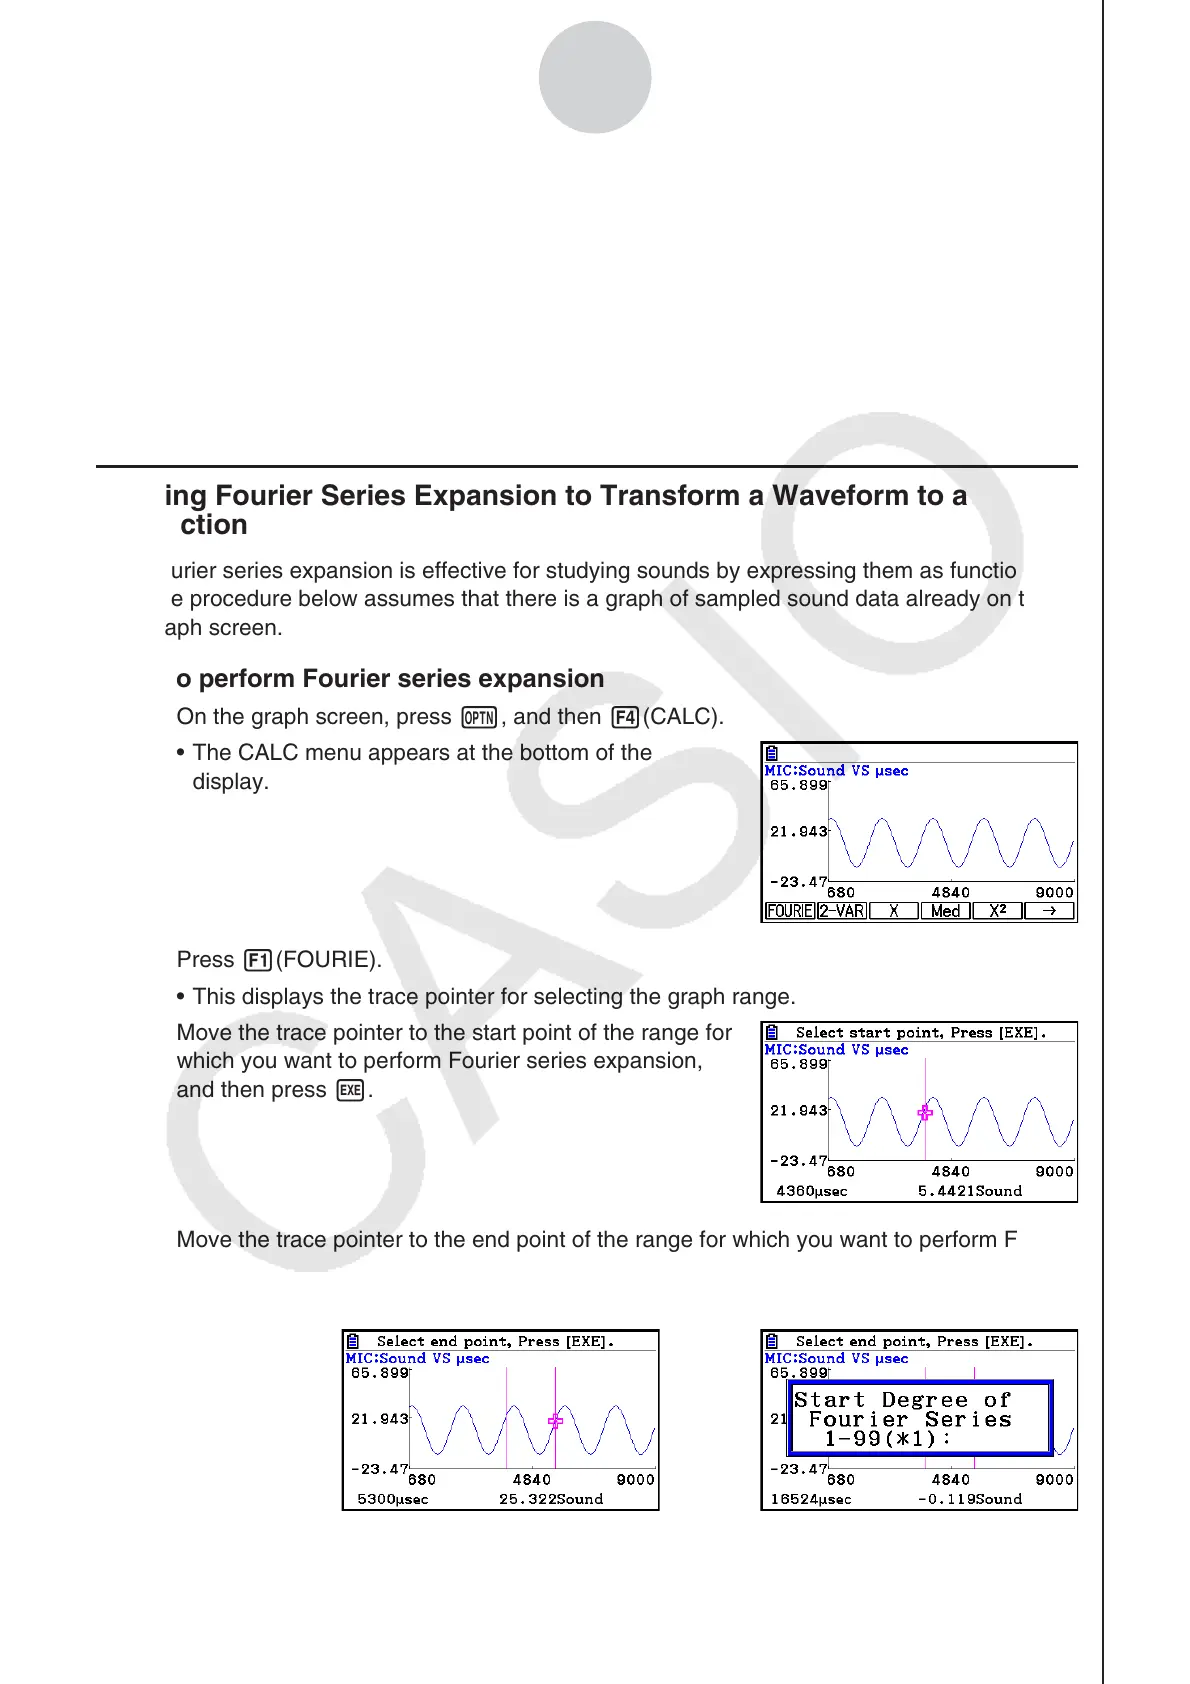
• To perform Fourier series expansion
1. On the graph screen, press K, and then 4(CALC).
• The CALC menu appears at the bottom of the
display.
2. Press 1(FOURIE).
• This displays the trace pointer for selecting the graph range.
3. Move the trace pointer to the start point of the range for
which you want to perform Fourier series expansion,
and then press w.
4. Move the trace pointer to the end point of the range for which you want to perform Fourier
series expansion, and then press w.
• This displays a dialog box for specifying the start degree of the Fourier series.
→