2010080120100801
ε-45
Graph Analysis Tool Graph Screen Operations
• To perform quadratic regression
1. On the graph screen, press K, and then 4(CALC).
• The CALC menu appears at the bottom of the display.
2. Press 5(X
2
).
• This displays the trace pointer for selecting the range
on the graph.
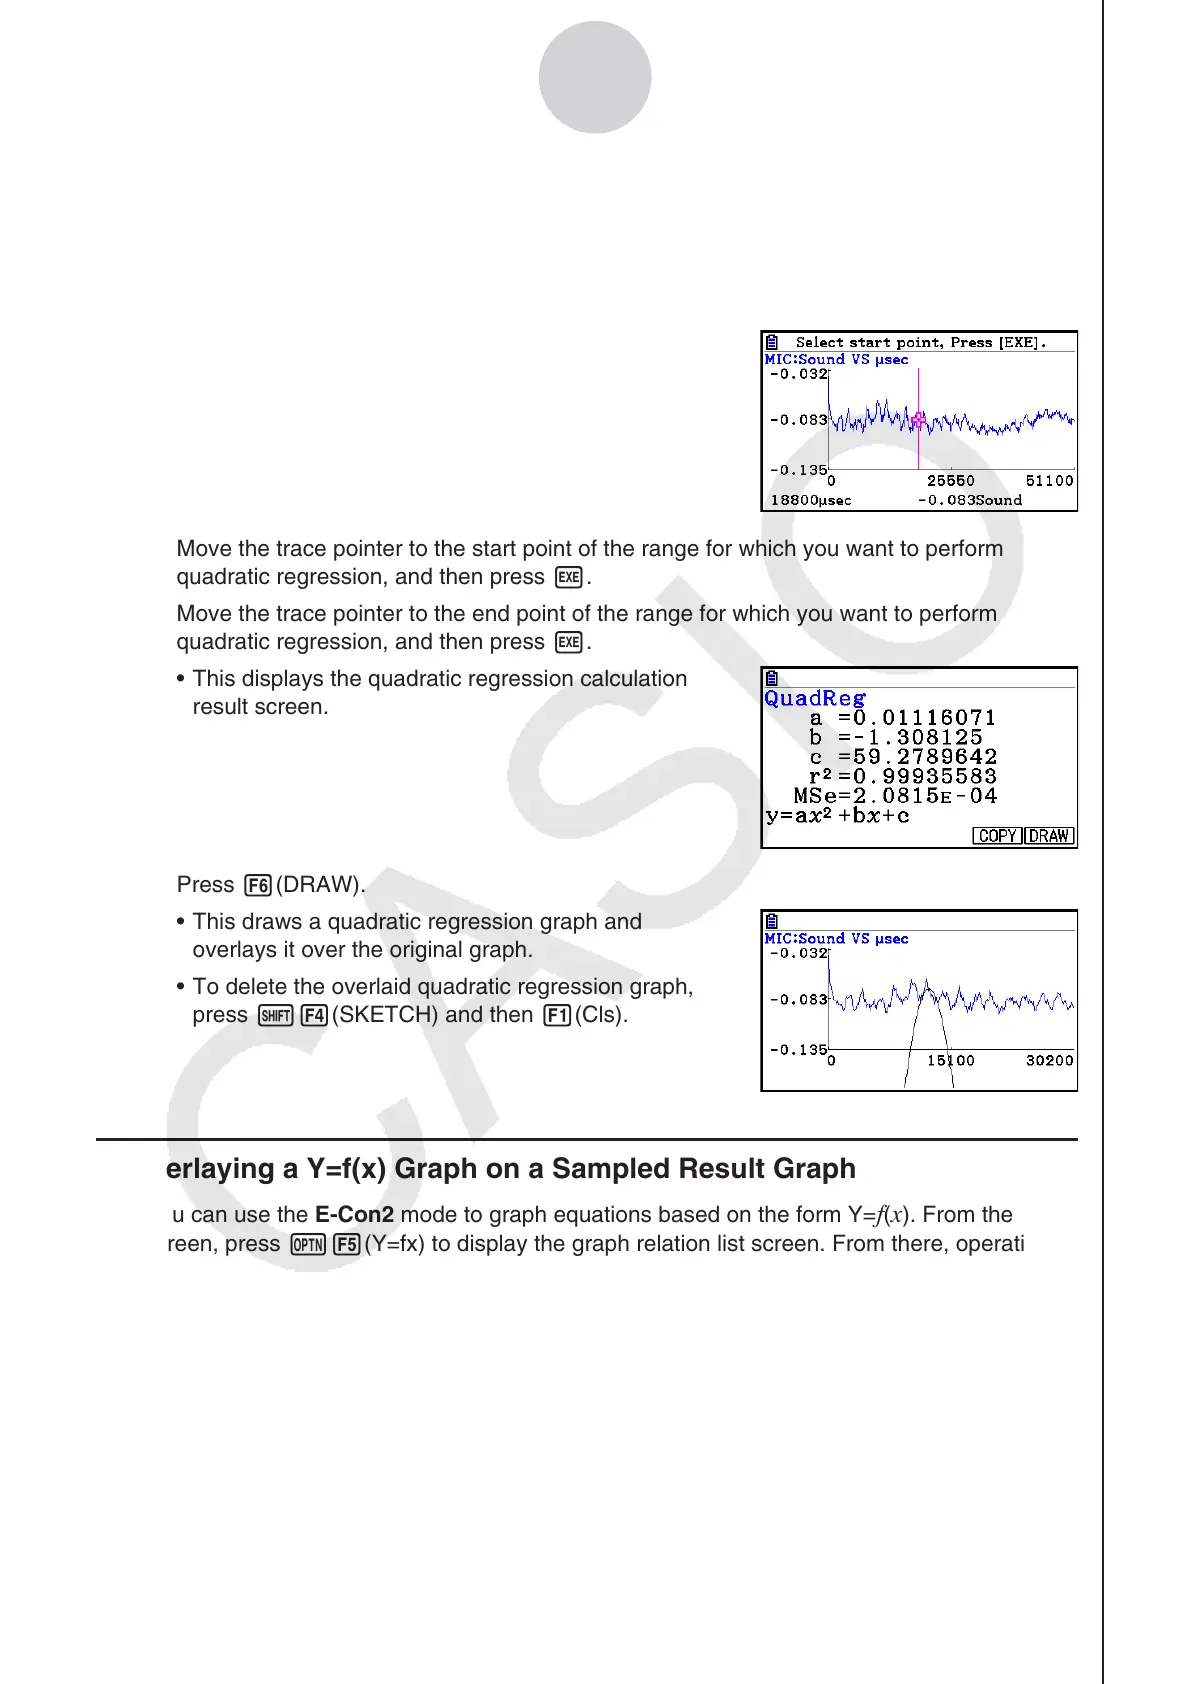
3. Move the trace pointer to the start point of the range for which you want to perform
quadratic regression, and then press w.
4. Move the trace pointer to the end point of the range for which you want to perform
quadratic regression, and then press w.
• This displays the quadratic regression calculation
result screen.
5. Press 6(DRAW).
• This draws a quadratic regression graph and
overlays it over the original graph.
• To delete the overlaid quadratic regression graph,
press !4(SKETCH) and then 1(Cls).
k Overlaying a Y=f(x) Graph on a Sampled Result Graph
You can use the E-Con2 mode to graph equations based on the form Y=f(x). From the graph
screen, press K5(Y=fx) to display the graph relation list screen. From there, operations
are identical to those in the Graph mode.
Note
• The data on the graph relation list screen is shared with the Graph mode. Note, however,
that only Y= type graphs can be used in the E-Con2 mode. Because of this, calling up
the graph relation list screen from the E-Con2 mode will display a “Y” (Y= type) item for
function menu key 3. Also, 5(MODIFY) is not displayed, because it is not used in the
E-Con2 mode.