GridScan/Pro English
10 © CEDES | V 1.0
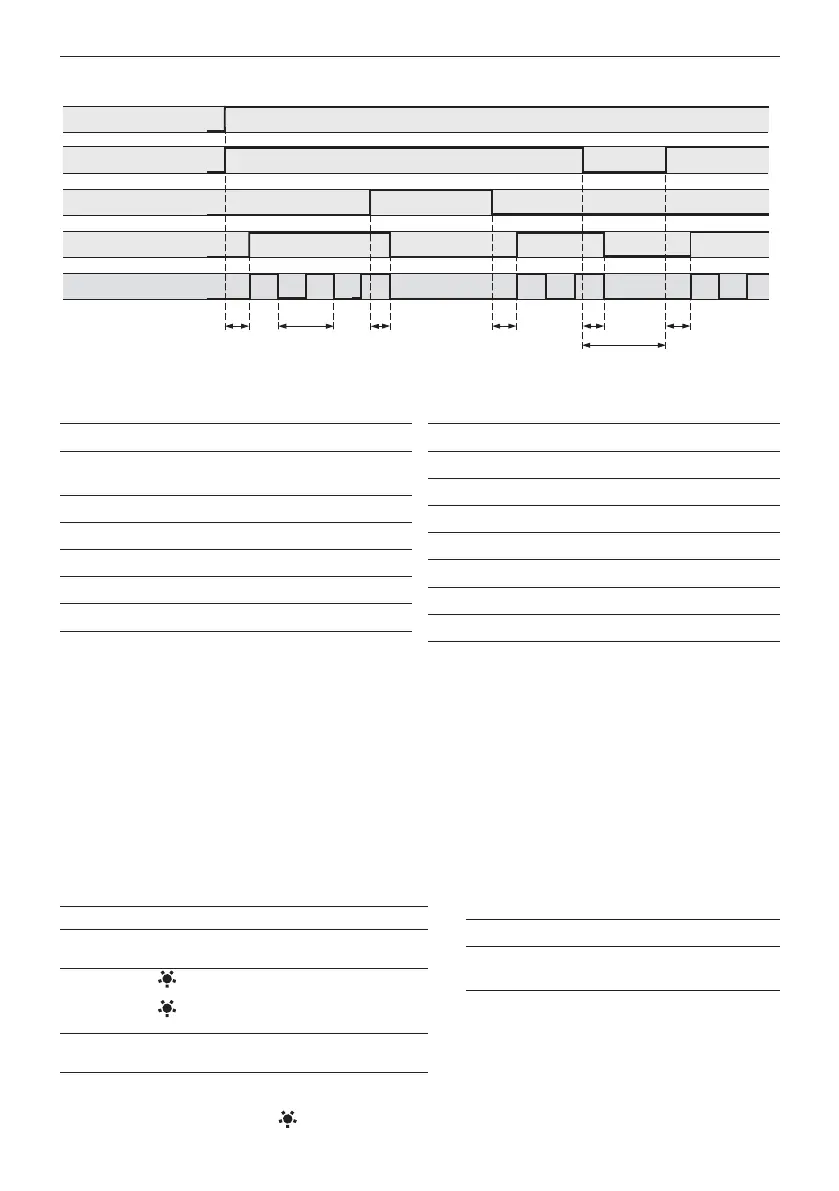
9. Timing diagram
Figure 13: General timing diagram
Table 2: General timing table
Table 3: General value table
10. Start-up
1. Switch on mains and power-up the door control unit. The LED on the receiver edge blinks during the start-up phase.
2. Check the LED on both edges (power, status).
3. Test if the system is working correctly by letting the door open and close, interrupting the light during the opening
and closing process.
11. LED status description
Receiver edge (Rx) Emitter edge (Tx)
Table 4: LED status description receiver edge
= LED on = LED off = LED blinking
Table 5: LED status description emitter edge
t
2
t
1
t
4
t
7
t
5
t
3
t
6
HIGH
LOW
HIGH
LOW
Test input (L)
Object
detection
Output (PNP/NPN)
NO OBJECT
OBJECT
TEST
USP
GND
Power supply
HIGH
LOW
FSS output
Time Value [ms]
Power-up time t1 max. 1,700
Response time with 22
elements
t2 typ. 40
max. 80
Release time t3 max. 50
Test response time t4 max. 80
Restart time t5 max. 200
FSS sequence time t6 1
Test time t7 min. 100
PNP / NPN
Power supply USP 10 ... 30 VDC
Power supply GND 0 V
Test input HIGH > 10 VDC
Test input LOW < 2 VDC
Output HIGH > USP - 2 VDC
Output LOW < 2 VDC
FSS output HIGH 3.4 … 4.2 VDC
FSS Output LOW < 1 VDC
Green LED Red LED Sensor status
Light curtain free
Safeguarded area interrupted
or door closed
Start-up (slow blinking)
Internal malfunction (fast
blinking)
No power or edge is
defective (see Chapter 12)
Green LED Sensor status
Power OK
No power or edge is defective
(see Chapter 12)