MANUALPC-2010 CHAPTER IV - OPERATION Page 49
CALIBRATION SUBMENUS
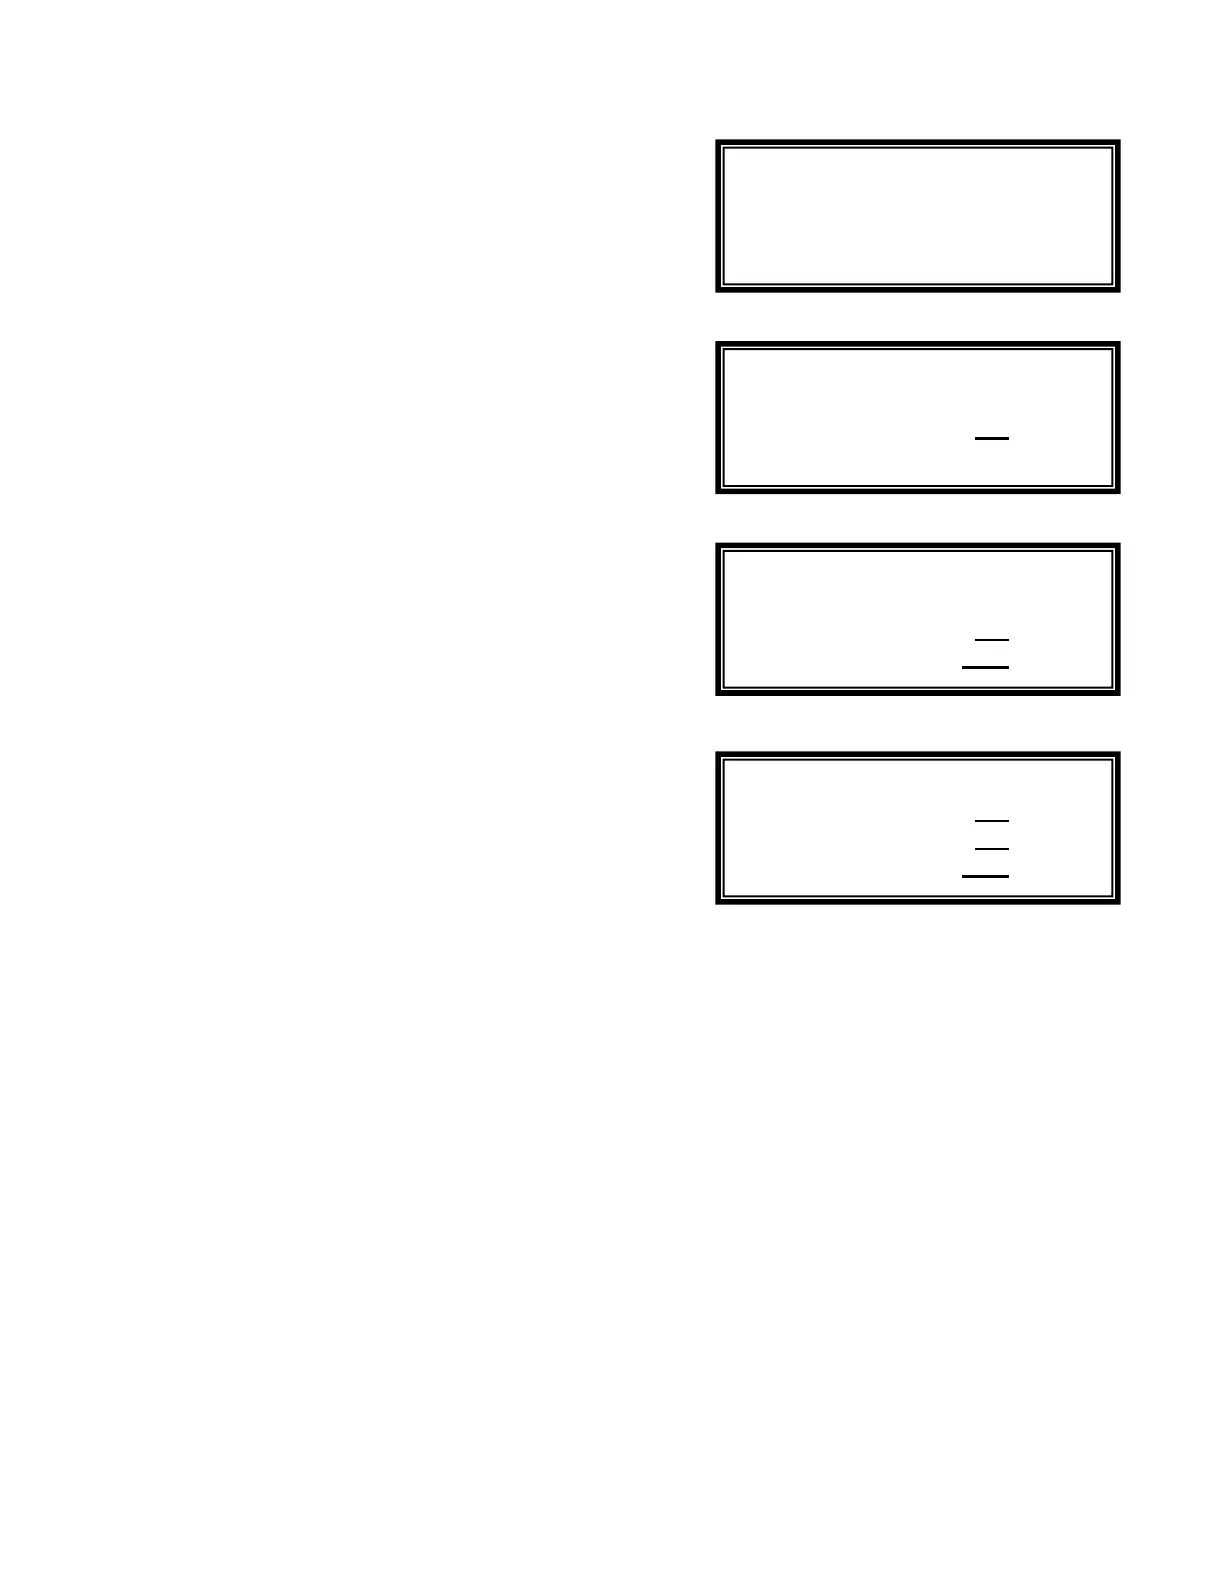
X.2 - Calibration Options
The CALIBRATION Submenu is common to all the functions
that require sensor calibration. This includes Sanitizer, pH,
Conductivity and Temperature. It allows calibration for 1, 2 or
3-point - depending on the degree of accuracy that is required.
The CALIBRATION OPTION Submenu is used to select the
number of calibration points desired. Most applications require
only 1- Point calibration but any number up to three can be
selected. If more than 1-point calibration is selected, the
operator needs to use the required number of sample
solutions. These sample solutions must be spaced sufficiently
from one another to yield meaningful calibration values.
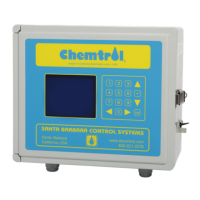
X.2.1 - One-Point Calibration
W
hen using 1-Point calibration, the conversion curve for the
sensor readings is a straight line. The slope is a default value
that is built in the program.
1-Point calibration should be satisfactory for most applications.
The operator places the sensor in a single water sample and
tests it with an appropriate test kit. The value obtained is then
entered on the calibration screen as the new display value.
The controller uses the calibration value that has been entered
by the operator to calculate the origin “a” of the representative
linear equation:
DISPLAY = a + SLOPE * INPUT
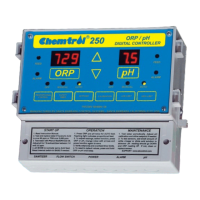
X.2.2 - Two-Point Calibration
With 2-Point calibration, the operator needs to use two different
solutions with values that are spaced widely enough to show
significant differences in the slope of the calibration curve.
The controller uses these values to calculate the origin “a” and
slope “b” in the equation:
DISPLAY = a + b * INPUT
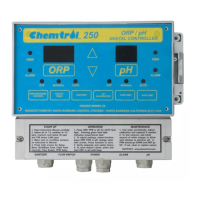
X.2.3 - Three-Point Calibration
W
ith 3-Point calibration, the straight line is replaced by a
second-degree polynomial curve. The operator needs three
calibration solutions with values that are sufficiently spaced
apart to show differences in the curvature of the polynomial.
The controller uses these three values to calculate the origin
“a”, slope “b” and curvature “c” in the equation:
DISPLAY = a + b * INPUT + c * INPUT*INPUT
Submenu X.2
Submenu X.2.1
Submenu X.2.2
Submenu X.2.3
Point 1 4.0
Point 2 7.5
Point 3 10.0
1 Point (zero)
2 Point (slope)
3 Point (curve)
Point 1 7.5
Point 1 7.5
Point 2 10.0