73
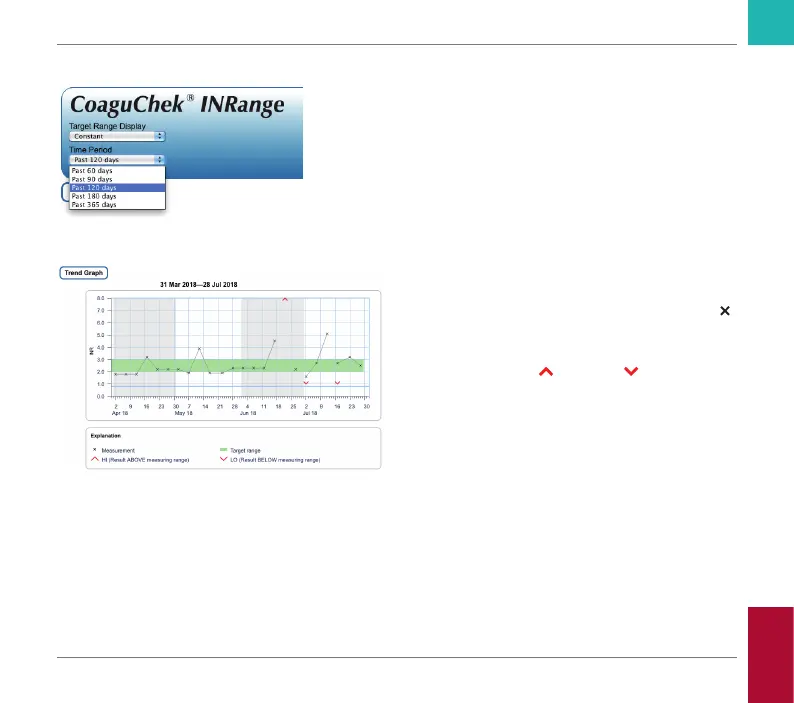
Time period
Starting from your most recent test result, you
can choose a Time Period going back 60, 90,
120, 180, or 365 days. This setting is applied
to both the Trend and Target graph.
Trend graph
All test results stored within a selected period
of time will be displayed in the chart as linear
values. Each test result (represented by the
symbol) is plotted along the time axis accord-
ing to the time when the test was performed.
Test results above
or below the measur-
ing range are marked accordingly. All test
results are connected by a line in chronologi-
cal order.
Vertical lines on the Trend graph mark the
beginning of each week.
Reviewing and Handling Data
CoaguChek INRange User’s Manual