DGS-3200 Series Layer 2 Gigabit Ethernet Managed Switch
187
Port
Use the drop-down menu to choose the port that will display statistics.
Time Interval
Select the desired setting between 1s and 60s, where "s" stands for seconds. The default
value is one second.
Record Number
Select number of times the Switch will be polled between 20 and 200. The default value is
200.
Unicast
Counts the total number of good packets that were received by a unicast address.
Multicast
Counts the total number of good packets that were received by a multicast address.
Broadcast
Counts the total number of good packets that were received by a broadcast address.
Show/Hide
Check whether or not to display Multicast, Broadcast, and Unicast Packets.
Clear
Clicking this button clears all statistics counters on this window.
View Table Clicking this button instructs the Switch to display a table rather than a line graph.
View Graphic Clicking this button instructs the Switch to display a line graph rather than a table.
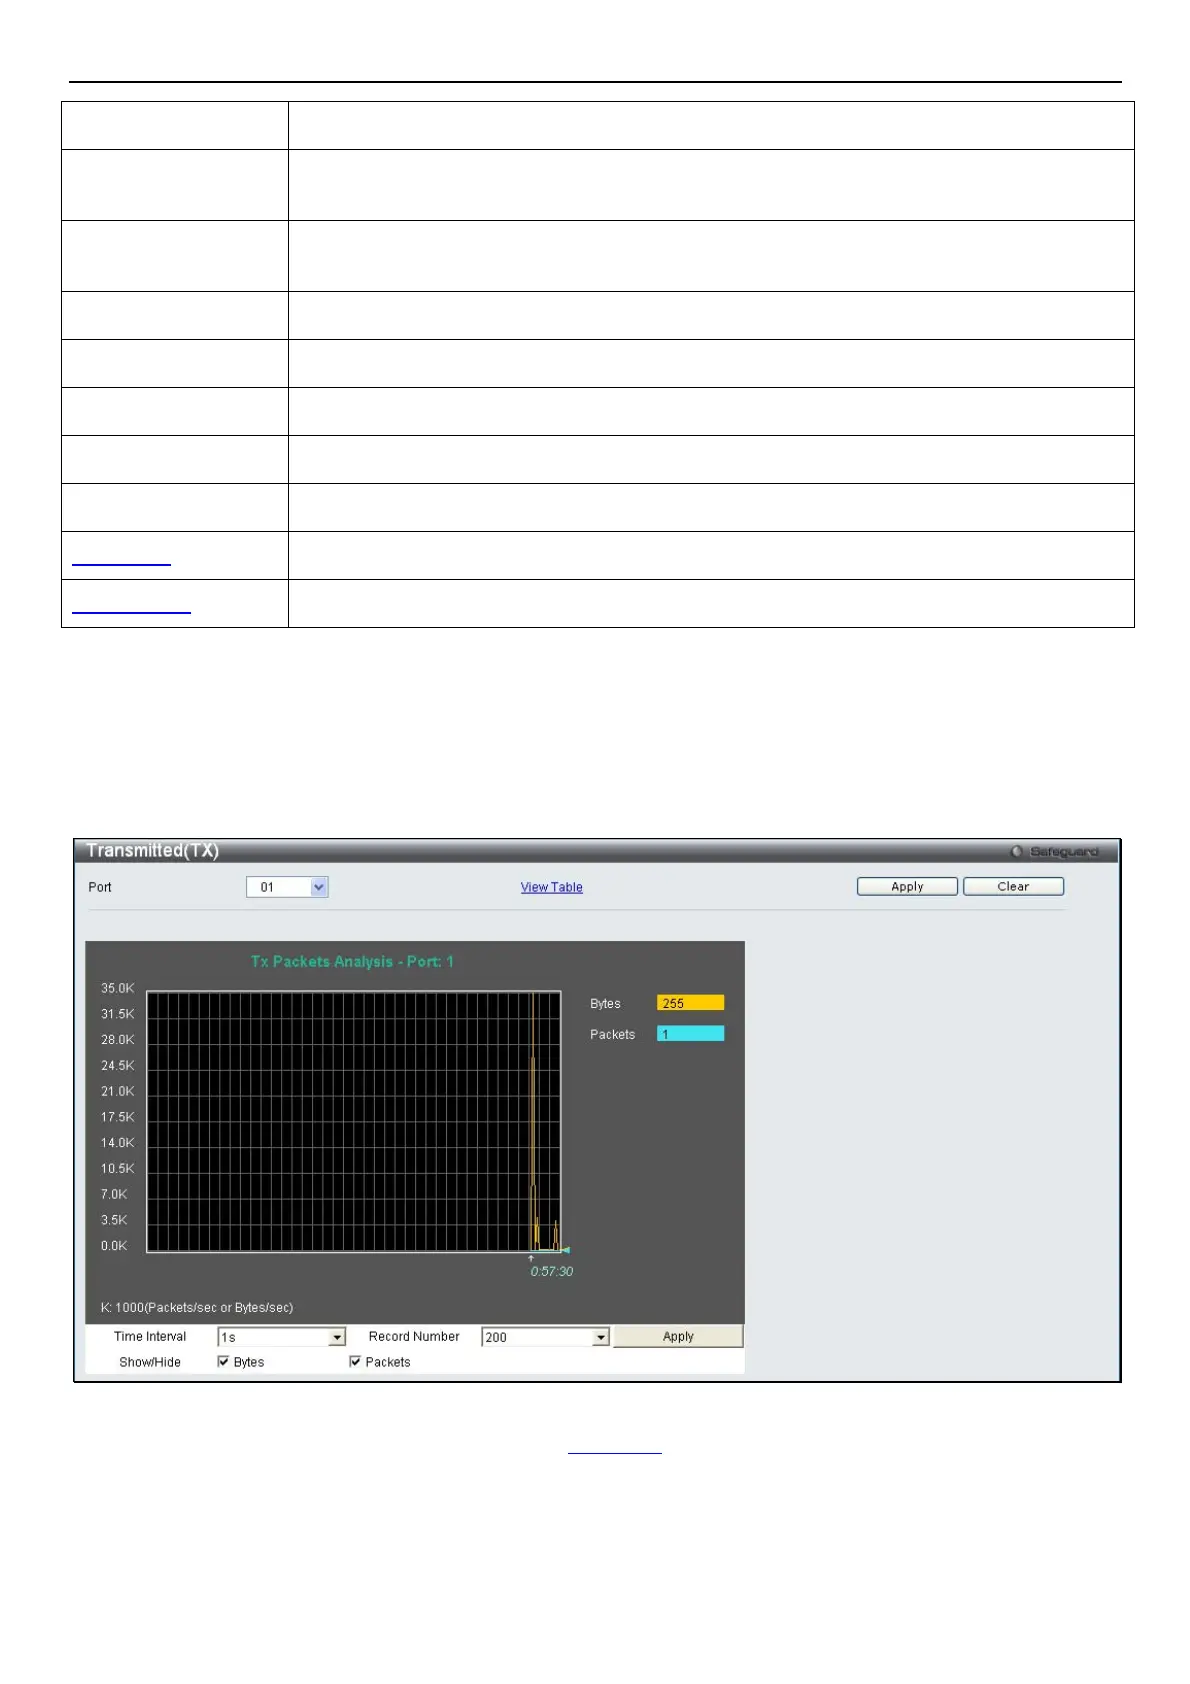
Transmitted (TX)
Click Monitoring > Packets > Transmitted (TX) to view the following graph of packets transmitted from the Switch. To select a
port to view these statistics for, select the port by using the Port pull-down menu. The user may also use the real-time graphic of
the Switch at the top of the web page by simply clicking on a port.
Figure 11- 9. Transmitted (TX) window (for Bytes and Packets)
To view the Transmitted (TX) Table window, click the link View Table.
 Loading...