USING THE SOFTWARE
Windows Menu
56
Plot
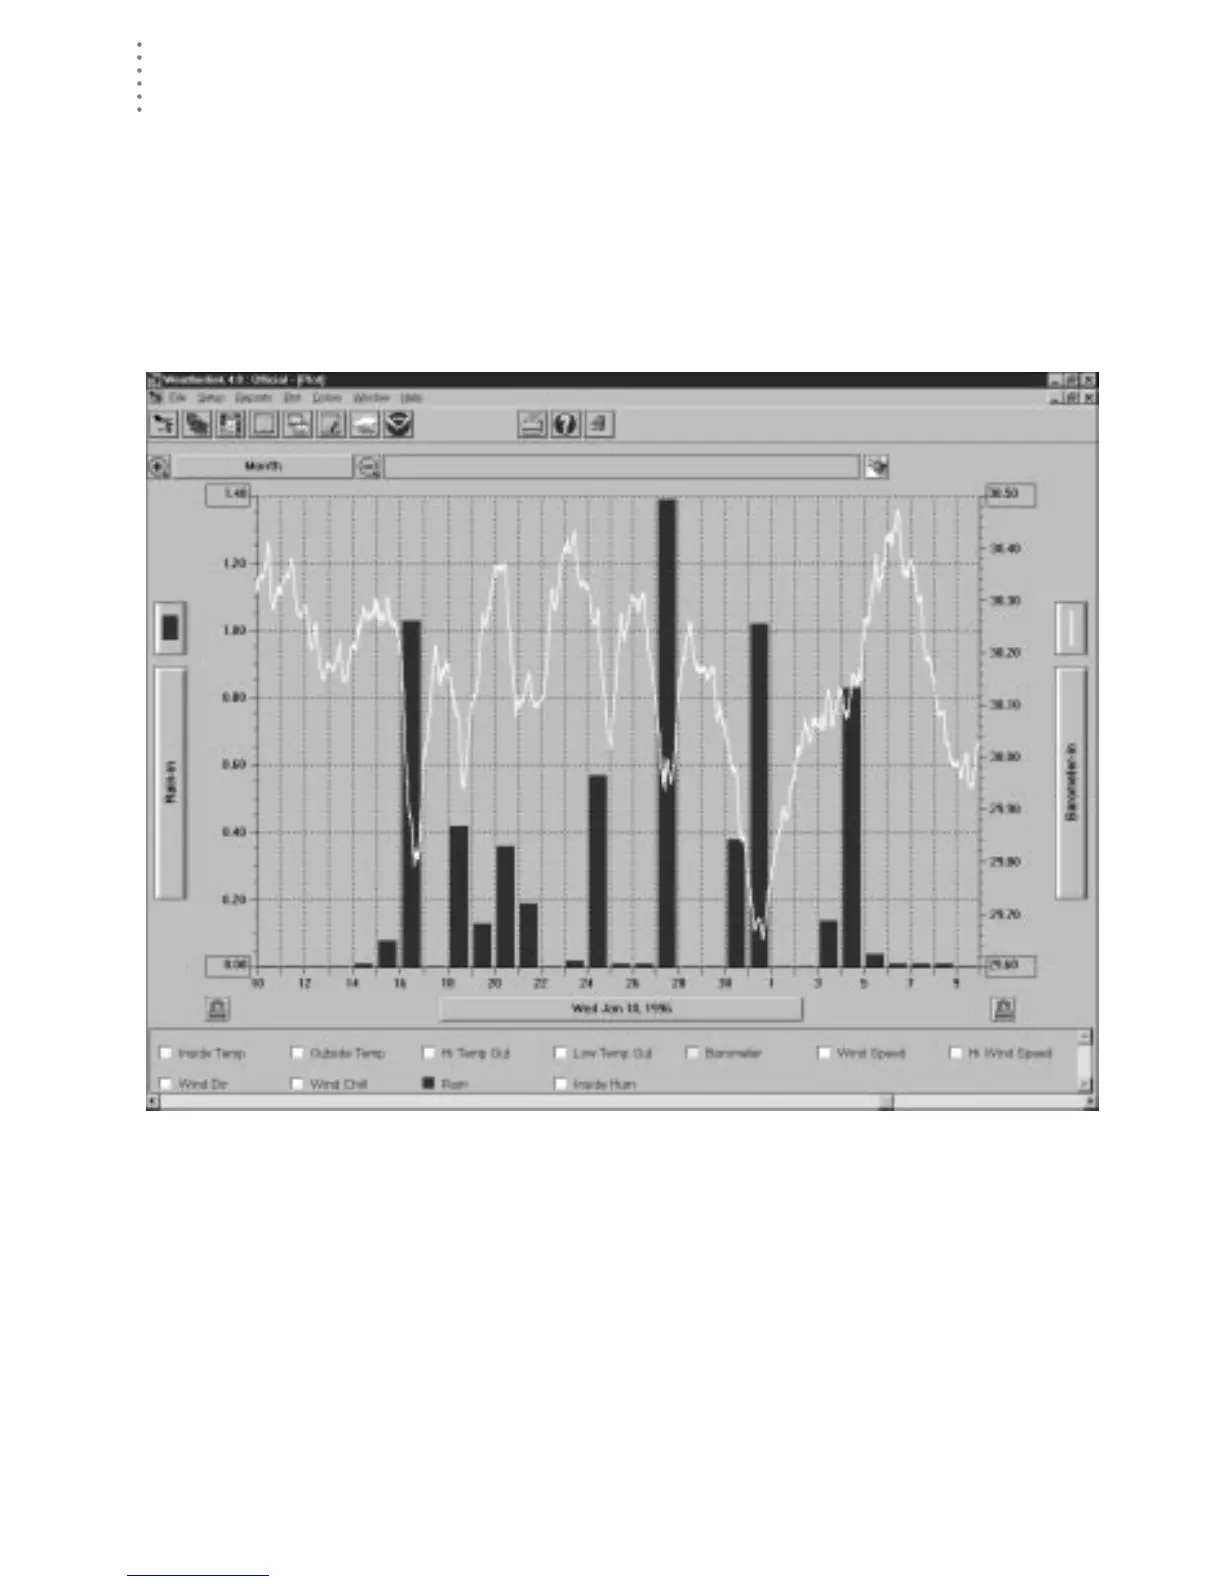
The WeatherLink software includes a powerful plotting engine which allows you
to plot as many conditions as you want on a single plot. You can also save plots
and plot templates for later viewing.
▲ To plot data, choose Plot from the Windows menu, click on the Plot icon in the tool-
bar, or press Ctrl-Q.
The Plot window appears. For complete instructions on using the Plot win-
dow, see “Using the Plot Window” on page 65.
P
LOT
W
INDOW
Strip Charts
The strip charts offer you 4 line graphs which update in real-time as long as they
are open. You may select the data you want to plot on the strip charts and the
span over which you want it plotted.