Measurement
6.1.2.1 Sampling and Digital Filter
Our first try is quite naïve: we sample the signal at 2kHz (over
twice the frequency that we are interested in) and then apply a
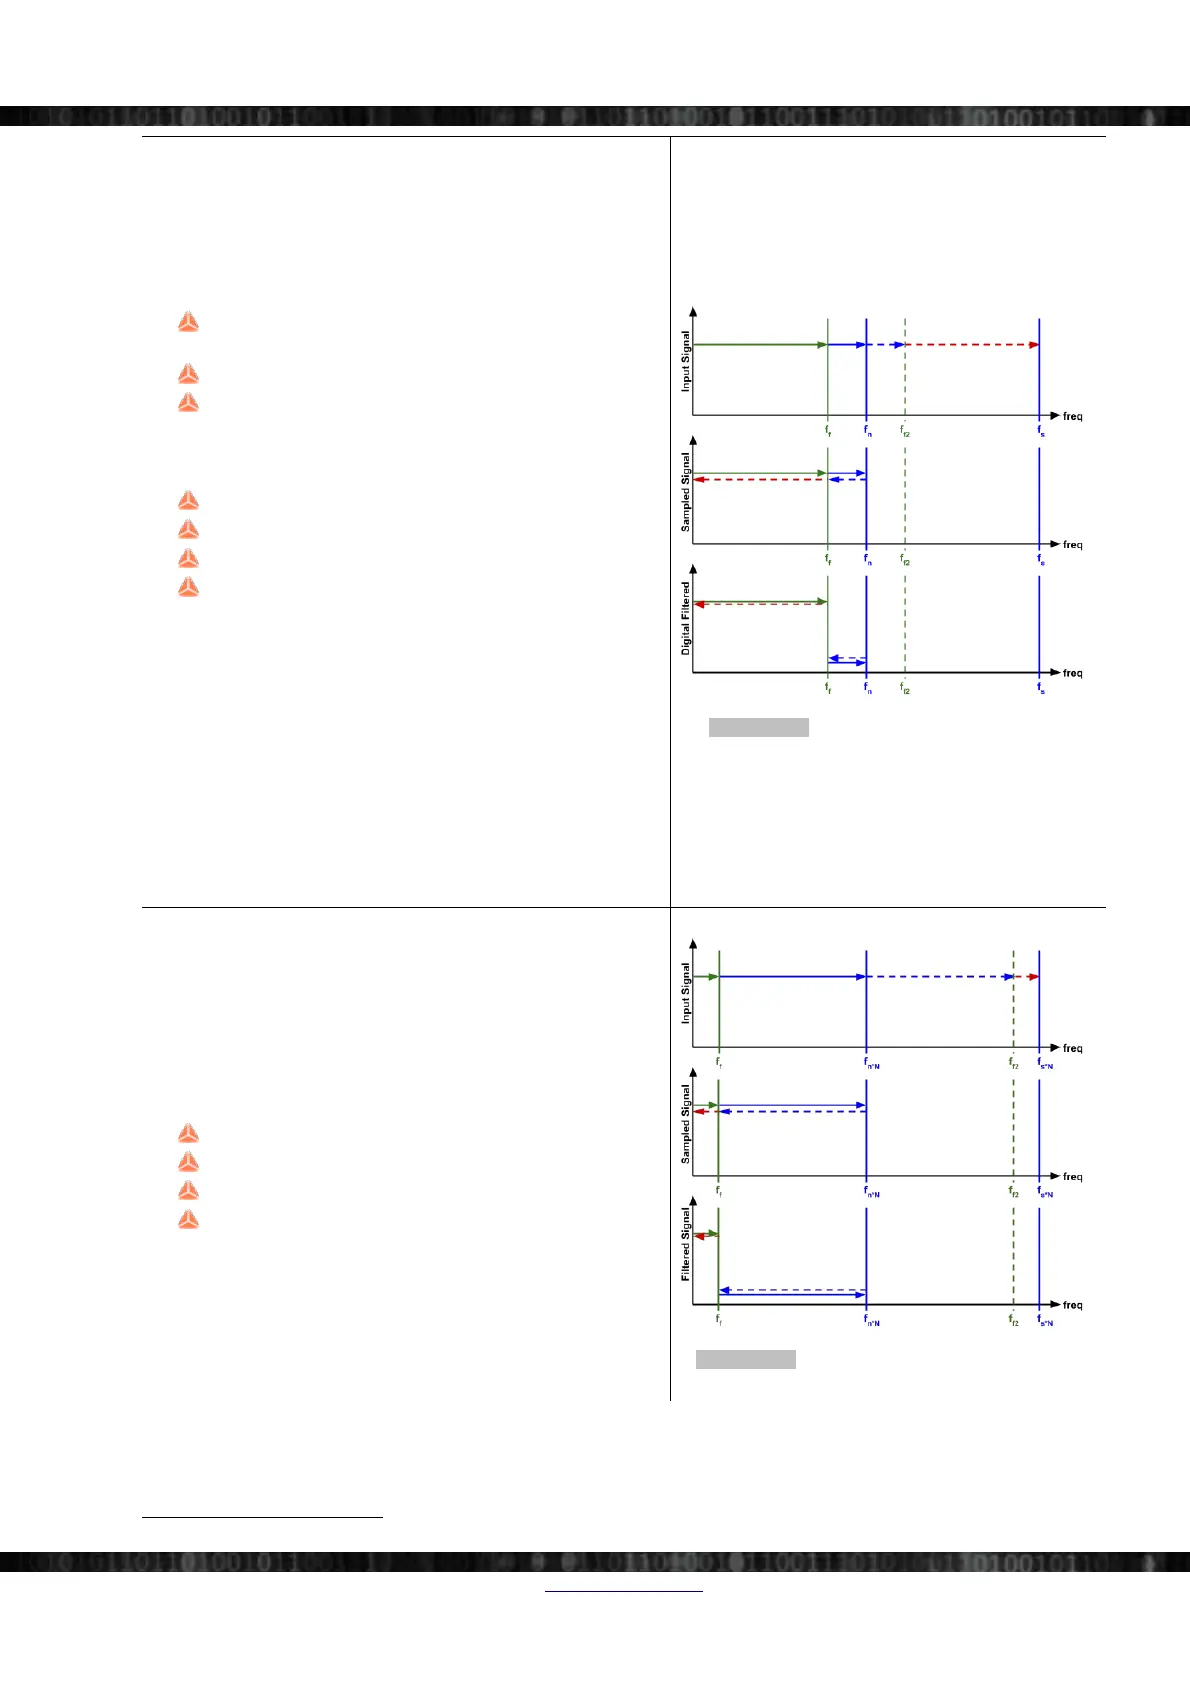
digital filter. Illustration 182 includes 3 diagrams (from top to
bottom):
Input Signal: e.g. the analogue signal that we input to
the AD converter
Sampled Signal: the output of the AD converter
Filtered Signal: the output of the digital filter (the filter-
input is the Sampled Signal)
Legend for Illustration 182:
f
s
: Sampling frequency: e.g. 2kHz
f
n
: Nyquist frequency: 1kHz
f
f
: Filter frequency: e.g. 800Hz
f
f2
: f
s
-f
f
: 1.2kHz
Sampled Signal: Since we have a sampling frequency of 2kHz
all signals over 1kHz are folded back to the Nyquist band (due to
aliasing) when they are sampled by the AD converter (dashed
lines in Illustration 182): Thus the Sampled Signal will already
contain the wrong signal components.
The digital filter will now attenuate all frequencies of the
Sampled Signal (which already contains the aliased signals) that
are higher than 800Hz.
Filtered Signal: Now the measurement result is wrong, because
it also contains the aliased frequencies from the input signal (the
red dashed line). Note, that we don't care about the aliased signal
of the blue dashed line because this is still higher than 800Hz.
Illustration 182: Sampling and Digital Filter
24
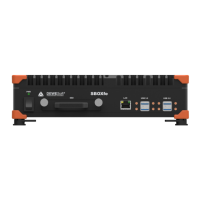
6.1.2.2 Oversampling and Digital Filter
Now, let us consider the effects of oversampling. Let's assume
that we oversample by a factor of N=5. This means that our AD
converter will now sample at a speed of 2kHz*5=10kHz and so
the Nyquist frequency is 5kHz.
Legend for Illustration 183:
f
s*N
: Sampling frequency (oversampling): 10kHz
f
n*N
: Nyquist frequency: 5kHz
f
f
: Filter frequency: e.g. 800Hz
f
f2
: f
s*N
-f
f
: 9.8kHz
In comparison to the previous example (without oversampling),
you can see that we get basically the same result – only the range
of the wrong signal components (red-dashed line) is now much
smaller. So oversampling somewhat improves the result, but it's
still not perfect. We need to find a way to reduce the impact of
the troublesome signal part (the red-dashed line).
Illustration 183: Oversampling and digital filter
24
24 Note, that some lines in the diagrams are moved a little bit up/down for readability, so that they don't overlap.
Doc-Version: 1.4.2 www.dewesoft.com Page 131/166