9-10 IM02601001E www.eaton.com
Functions on the Web Server Pages
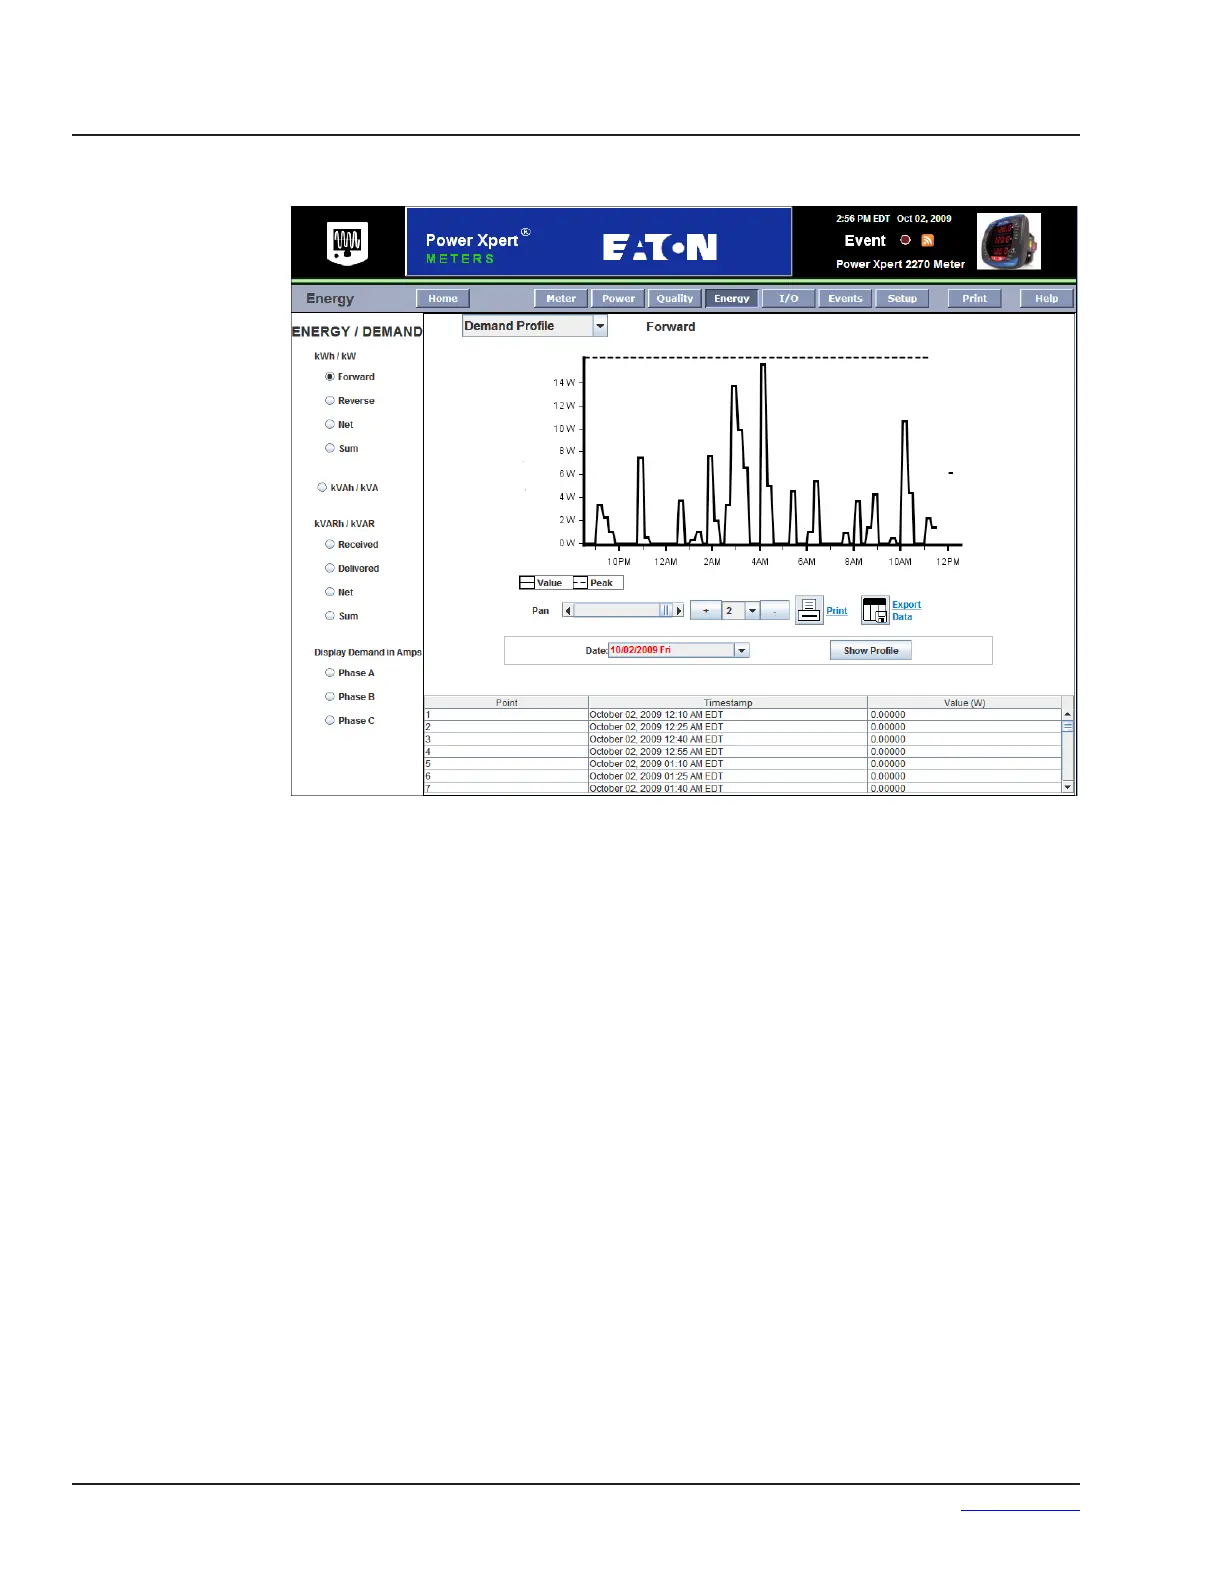
Demand Profile
Demand Comparison
The Demand Comparison page is similar to the page, but provides a
graph you can use to compare two overlaid demand plots from selectable periods of time.
You can select to compare plots between:
Today and Yesterday•
This Week and Last Week•
This Month and Last Month•
2 different Days•
2 different Weeks•
2 different Months•
Peak demand is shown in the graph as a dashed line.
 Loading...