User Manual
Enterprise Access Point
68
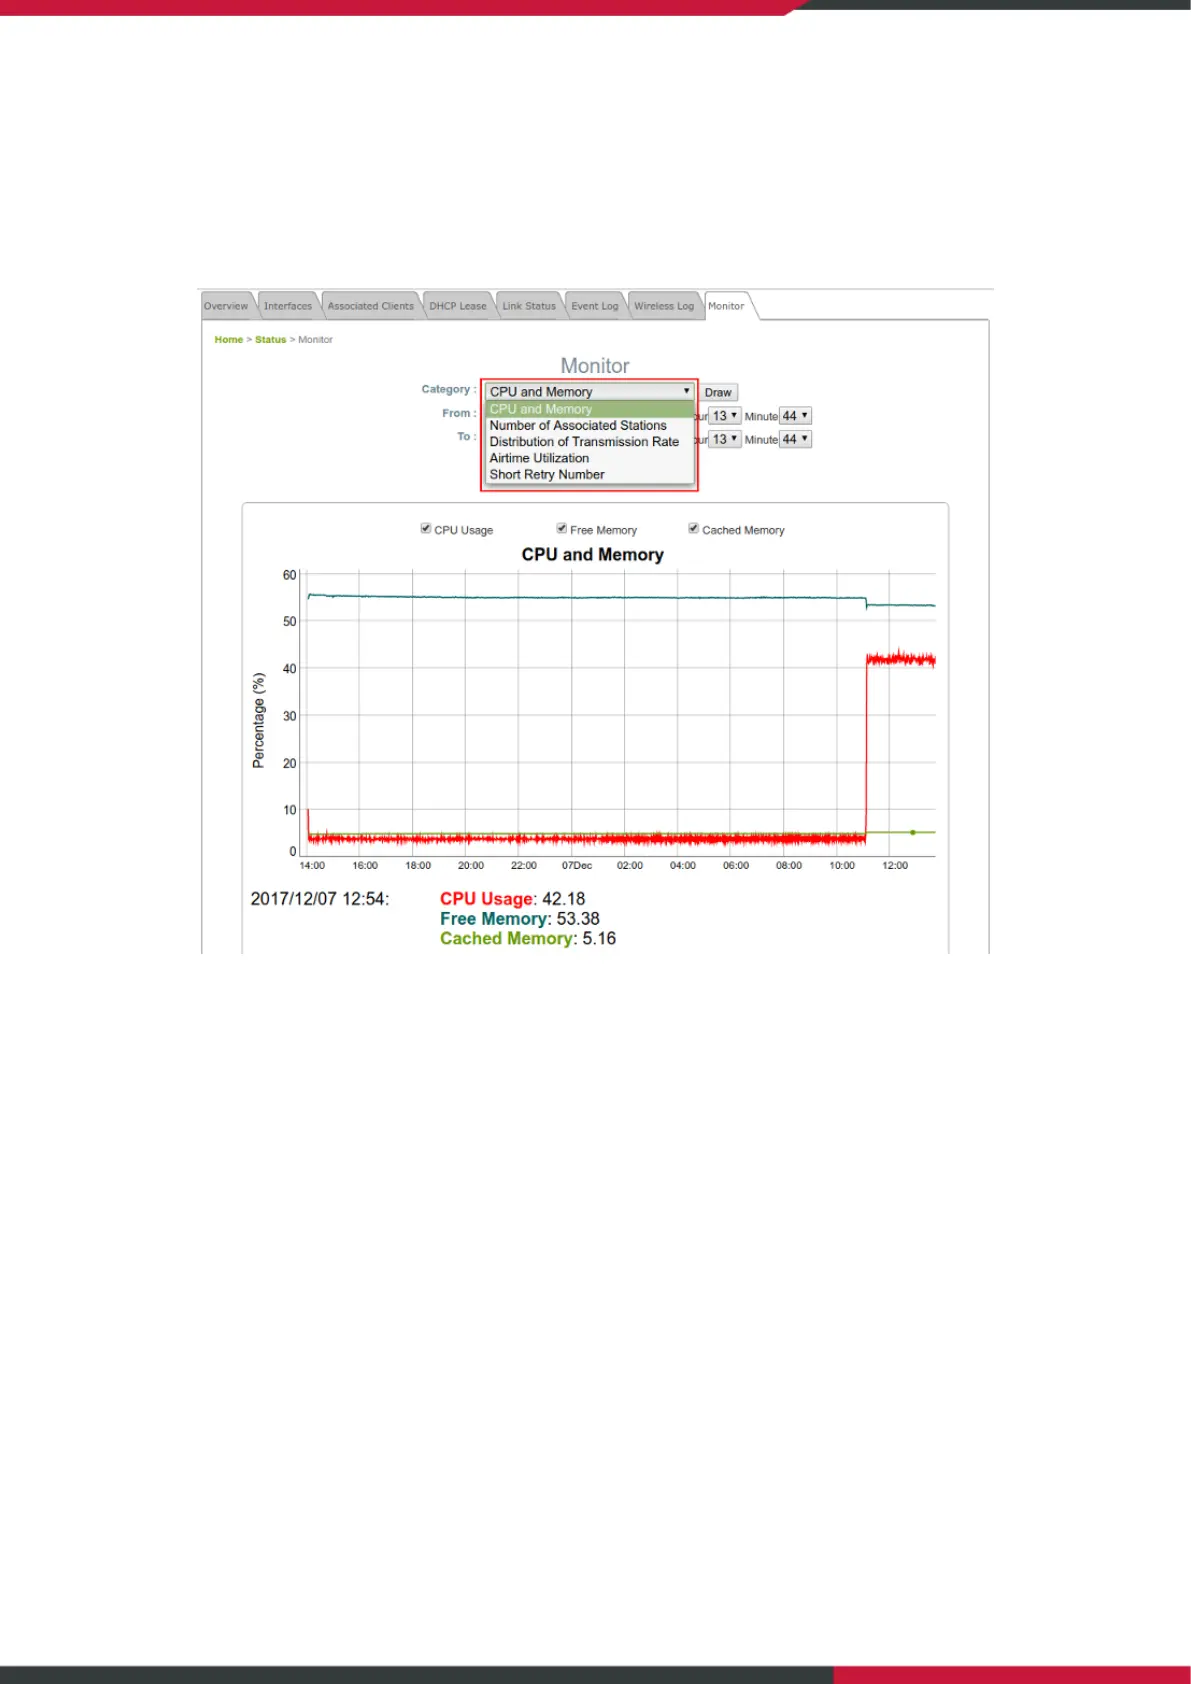
7.8 Monitor
Multiple monitor charts provide a quick overview on the AP’s performance in time dimension. Begin and
End time for each chart can be selected for filtering data. Left click on the mouse to zoom in on desired
regions. Double click to return the plot to its original scale.
CPU and Memory: to view the usage of the devices. CPU < 90% and RAM < 90% is acceptable
Number of Associated Station: to view the number of devices connected to the selected radio (RF Card
A or RF Card B).
Distribution of Transmission Rate: to view the number of packets transmitted categorized by
Transmission Rates.
Airtime Utilization: to view the Signal-to-Noise of the Wireless Environment. Airtime Utilization < 70% is
optimal
- RX Clear Rate: The percentage of the airtime the current channel utilizes.
- RX Frame Rate: The percentage of airtime that the AP receives and decrypts.
- TX Frame Rate: The percentage of airtime from the AP transmitting data.
Short Retries Number: to view the number of packets re-transmitted. Short Retry < 200 is optimal
 Loading...