Figures PlasmaQuant MS product family
6
Figures
Fig. 1 Safety markings on the PlasmaQuant MS ......................................................... 12
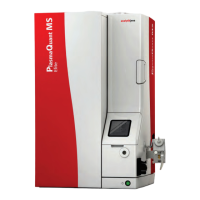
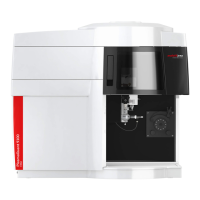
Fig. 2 PlasmaQuant MS – Front view with major components .................................. 21
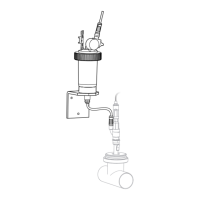
Fig. 3 Sample introduction system in the PlasmaQuant MS ...................................... 22
Fig. 4 Concentric nebulizer (left) and spray chamber (right) ..................................... 23
Fig. 5 Standard one-piece torch ................................................................................... 23
Fig. 6 Torch installed in the plasma compartment ..................................................... 23
Fig. 7 Torch and induction coil...................................................................................... 24
Fig. 8 PlasmaQuant MS with unlatched interface door .............................................. 25
Fig. 9 Sampler cone installed in the PlasmaQuant MS ............................................... 26
Fig. 10 Skimmer cone installed in the PlasmaQuant MS .............................................. 26
Fig. 11 Relative size distinction between polyatomic and analyte ion ........................ 27
Fig. 12 ReflexION ............................................................................................................. 28
Fig. 13 Curved pre-filters and mass analyzer ................................................................. 29
Fig. 14 All-digital extended dynamic range detector .................................................... 29
Fig. 15 Setup of PlasmaQuant MS .................................................................................. 30
Fig. 16 Dimensions of the PlasmaQuant MS ................................................................. 38
Fig. 17 Connections and interfaces on the rear side of the device ............................... 39
Fig. 18 Overview of connections on the right side of the instrument .......................... 40
Fig. 19 Switches and connections on the front side of the instrument........................ 40
Fig. 20 Transfer tube for Aerosol Dilution (left), standard transfer tube (right) ........ 47
Fig. 21 Sample tubing ...................................................................................................... 50
Fig. 22 Peristaltic pump - tubing connections ............................................................... 51
Fig. 23 Pump tubing with Internal Standard tubing ..................................................... 52
Fig. 24 Peristaltic pump - tubing connections with Internal Standard ........................ 52
Fig. 25 Instrument summary window ............................................................................ 54
Fig. 26 Time scan displaying the signal during warm-up ............................................. 56
Fig. 27 Automatic torch alignment ................................................................................. 60
Fig. 28 Peak resolution and trim .................................................................................... 61
Fig. 29 Mass calibration .................................................................................................. 62
Fig. 30 Detector voltage calibration ............................................................................... 63
Fig. 31 Setting up detector attenuation ......................................................................... 64
Fig. 32 Main page of the worksheet ............................................................................... 66
Fig. 33 Selecting elements and isotopes ........................................................................ 67
Fig. 34 Quickly adding elements and isotopes from the periodic table ....................... 68
Fig. 35 Selecting internal standard correction ............................................................... 68
Fig. 36 Adding or modifying isotope correction equations ........................................... 69
Fig. 37 Defining isotopes for the calculation of isotope ratios ..................................... 69
Fig. 38 Setting up calibration standards ........................................................................ 70
Fig. 39 Scan settings ........................................................................................................ 72
Fig. 40 Sampling Settings ................................................................................................ 73
Fig. 41 QC test settings .................................................................................................... 74
Fig. 42 Copying optimization settings ............................................................................ 77
Fig. 43 Default settings in the scan setup window ........................................................ 78
Fig. 44 Selecting an optimization routine ...................................................................... 80
Fig. 45 Starting optimization .......................................................................................... 81
Fig. 46 Signals of analyte, interference and analyte/interference ratio ...................... 82
Fig. 47 Schematic of detector attenuation ..................................................................... 86
Fig. 48 Linear dynamic range of different attenuation modes ..................................... 87
Fig. 49 Incorrect settings for detector calibration ......................................................... 90
Fig. 50 Configuring scan settings for attenuation calibration ...................................... 91
Fig. 51 Detector calibration tab ...................................................................................... 92