Bench Top User’s Manual
Appendix
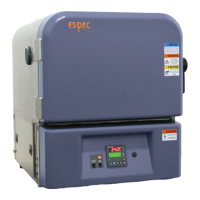
Temperature Heat-up Rate
FIGURE 9.9.TEMPERATURE HEAT UP RATE
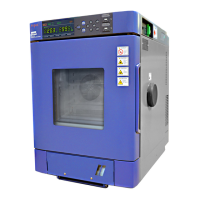
Temperature-Humidity Con-
trol Range
The range in which temperature and humidity can be reproduced inside
the chamber. It is normally expressed as a graph with temperature as the
x-axis and humidity as the y-axis.
FIGURE 9.10.TEMPERATURE-HUMIDITY CONTROL RANGE
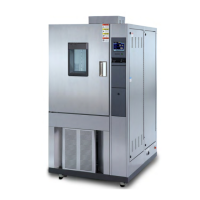
Temperature Pull-down Rate The time required for the temperature to change from a defined tempera-
ture t1 to a defined lower temperature t2. This is simply the time required
for the drop in temperature and does not include the time it takes for the
temperature to stabilize.
FIGURE 9.11.TEMPERATURE PULL-DOWN RATE
Temperature Range The range of temperatures that can be reproduced inside the chamber.
Temperature Gradient The difference in temperature between the highest and lowest tempera-
ture within the working space after stabilization.
Test Chamber A contained ambient constructed so as to obtain a desired temperature
and humidity.
Wet-Bulb Temperature The temperature measured by a temperature sensor on which a wet
cloth has been draped. Is is used to measure humidity. Relative humidity
is calculated from this temperature and the air temperature measured by
a dry-bulb sensor.
Wet-Bulb Wick The cloth draped over a wet-bulb temperature sensor. It absorbs water
and keeps the sensor wet. Though gauze is used in meteorological appli-
cations, a woven cloth is used inside an environmental chamber because
of its strong resistance to heat and cold.
t2
t1
Temperature
Time
Temperature
heat-u
rate
60°C
0
98
10°C
5
t1
t2
Temperature
Time
Tem perature
pull-down rate