19
207
Eversense E3 CGM User Guide
207
Eversense E3 CGM User Guide
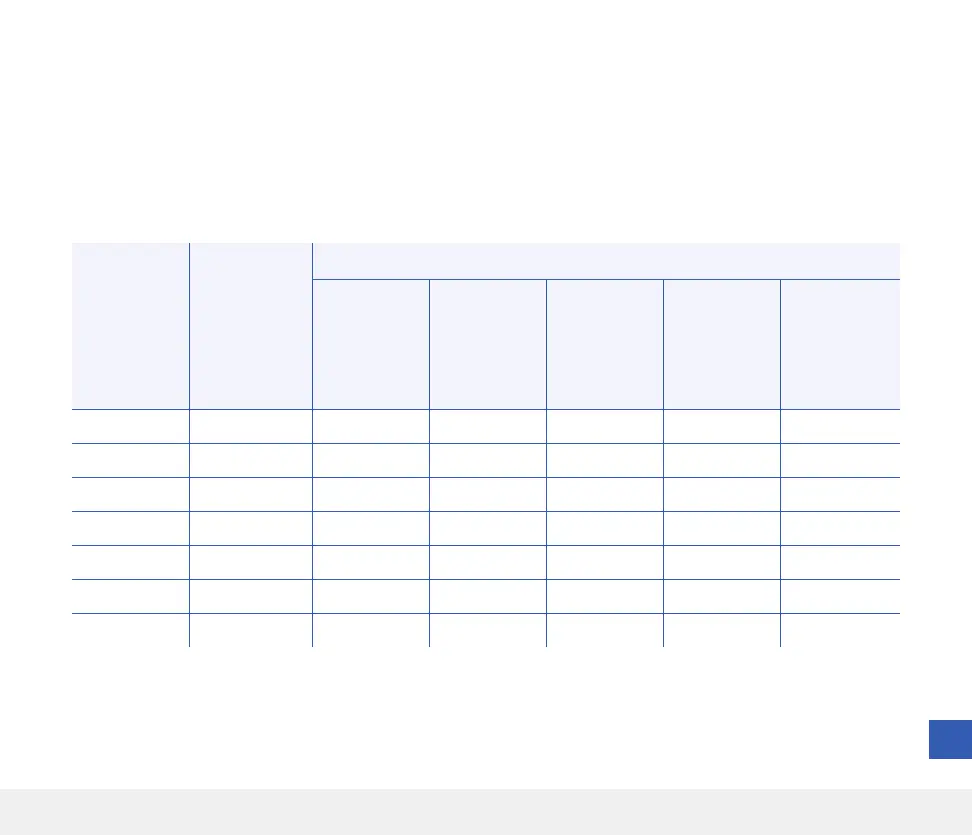
Table 3 – Eversense E3 Percentage of Readings in Agreement Overall in the PROMISE Study
Percent of CGM System Readings Within
CGM
System
Glucose
Range
(mg/dL)
Paired
CGM
and YSI
Reference
Percent
15/15%
of
Reference
Percent
20/20%
of
Reference
Percent
30/30%
of
Reference
Percent
40/40%
of
Reference
Percent
> 40/40%
of
Reference
Overall 12,034 87.3 93.9 98.6 99.6 0.4
40 - 60 574 91.6 96.5 98.6 99.3 0.7
61 - 80 1,178 89.7 93.8 98.9 99.8 0.2
81 - 180 5,078 85.1 93.2 98.5 99.6 0.4
181 - 300 3,493 87.0 93.7 98.4 99.6 0.4
301 - 350 1,191 93.3 96.8 99.2 99.6 0.4
351 - 400 520 87.3 93.8 98.7 99.6 0.4
Performance was also measured by calculating the percentage of sensor glucose readings within 15 mg/dL or 15%
of the YSI reference. These tables show the percent agreement at multiple levels, at dierent glucose ranges, and
at dierent days during the sensor wear. Results in the glucose ranges of 80 mg/dL or less reflect the percentage of
values within mg/dL, and results in the glucose ranges over 80 mg/dL reflect the percentage within reference. As an
example, glucose values between 40 and 60 mg/dL were within 15 mg/dL of the reference value 91.6% of the time.