7
63
Eversense E3 CGM User Guide
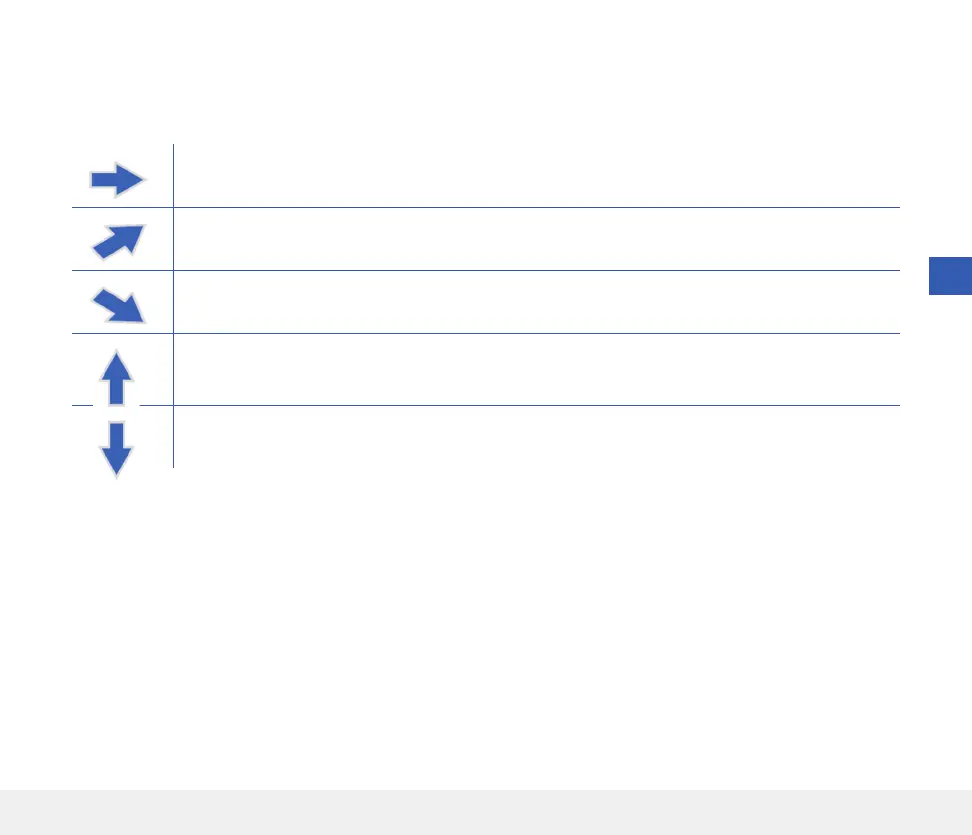
Gradually rising or falling glucose levels, falling or rising at a rate between 0.0 mg/dL and 1.0 mg/dL
per minute.
Moderately rising glucose level, rising at a rate between 1.0 mg/dL and 2.0 mg/dL per minute.
Moderately falling glucose levels, falling at a rate between 1.0 mg/dL and 2.0 mg/dL per minute.
Very rapidly rising glucose levels, rising at a rate more than 2.0 mg/dL per minute.
Very rapidly falling glucose levels, falling at a rate more than 2.0 mg/dL per minute.
Trend Arrows
There are 5 dierent trend arrows that show the current direction of your glucose levels, and how fast they are
changing.
The app uses the last 20 minutes of continuous glucose data for calculating glucose trends.
When there are not enough sensor values available to calculate a trend arrow, it is not displayed and the glucose
value is grey instead of black.
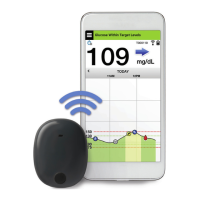
Before making a treatment decision, you should take into account the sensor glucose value, the trend graph, the trend
arrow and any alerts from the Eversense E3 CGM System. If no trend arrow is displayed, the system does not have
enough data to display direction and rate of change. You should not make a treatment decision based solely on the
sensor glucose value.