8. Thermal Imaging
8.1 Thermal Imager Basics
In the Thermal Imaging mode, the user can measure a
targeted surface’s temperature by detecting the energy
emitted by the surface under test. Color variations
reflect temperature variations. See Section 11.3,
Infrared Energy and Thermal Imaging Overview for in-
depth information. The laser pointer and display cross
hairs assist in targeting.
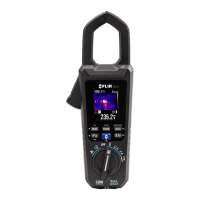
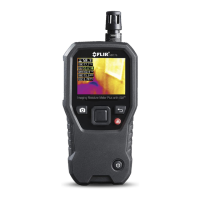
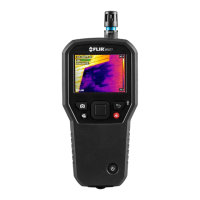
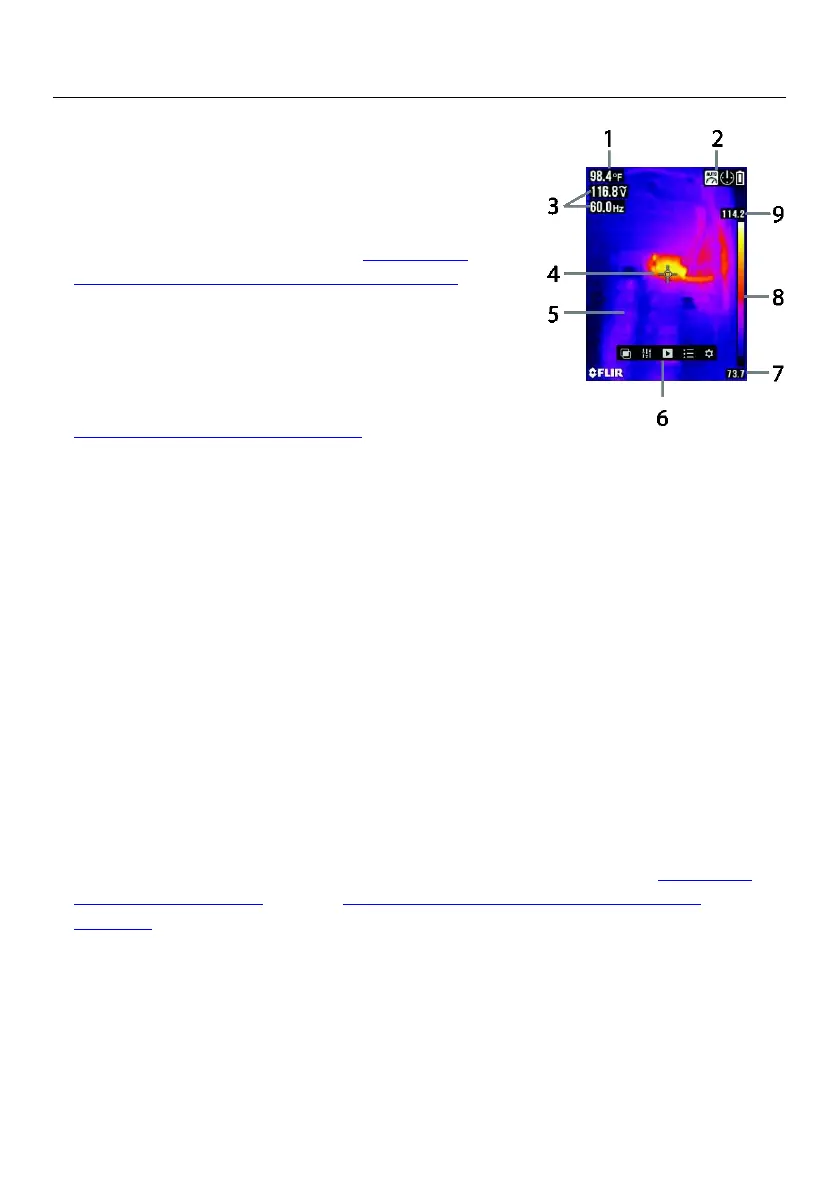
Press the IGM button to open the Thermal Imager. In
Fig 8-1 the meter is set to color palette IRON. Select
other palettes in the Thermal Settings Menu (refer to
Section 8.3, Thermal Settings Menu).
Fig. 8-1 Thermal Image Example
1. IR Temperature measurement represents the temperature of the spot sensed.
Note that while the imager initializes, dashes will display.
2. Status Icon Bar
3. Clamp Meter Measurement displays
4. Cross hairs for targeting spots
5. Thermal image
6. Main Menu
7. Lowest reading measured in the current frame
8. Thermal scale shows the range of colors for the thermal image. The lighter the
color, the warmer the temperature; the darker the color, the cooler the
temperature.
9. Highest reading measured in the current frame.
Note: Use the Thermal Settings Menu to change the emissivity; refer to Section 8.3,
Thermal Settings Menu. See also Section 11.1, Emissivity Factors for Common
Materials.
 Loading...