Do you have a question about the Fluke ScopeMeter 190 Series III and is the answer not in the manual?
Lists key parameters like voltage, current, DC link voltage, and AC ripple.
Identifies effects of low and high order harmonics on the electrical power system.
Provides guidance for motor drive input, DC bus, drive output, motor input, and shaft measurements.
Graphically shows connections and automatically triggers according to test procedures.
Reports feature used for troubleshooting and collaborative work with others.
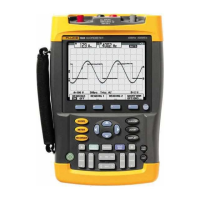
Offers full 500 MHz oscilloscope capability for electrical and electronic measurements.
Lists items included in the test tool kit by model type, including probes, chargers, and leads.
Instructions on powering the test tool from an AC outlet or battery, and initial setup.
Procedure to reset the test tool to factory default settings.
Explains how to navigate menus, select functions, and change settings using cursor keys and ENTER.
Describes the function and illumination status of various keys like HOLD, AUTO, and TRIGGER.
Details connecting probes to input channels A, B, C, and D for scope measurements.
Instructions for making motor drive voltage and current measurements.
How to select probe type (Voltage, Current, Temp) and attenuation for input A.
Explains how to set multiple input channels to the same range (V/div).
How to enable Auto Set for automatic waveform display optimization.
Steps to select and display Peak-Peak measurement for Input A.
Steps to select and display frequency measurement for Input B.
How to freeze the waveform and readings display.
Instructions on using the Average function to smooth waveforms by averaging acquisitions.
Explains the Smart Average mode for handling signal changes and noise.
How to use Persistence, Envelope, and Dot-Join for waveform visualization.
Procedure to enable Glitch Detect for viewing short events or HF modulated waveforms.
Using Glitch Off and Averaging On to suppress high frequency noise.
How to select acquisition speed (Fast, Full, Normal) and waveform memory depth.
How to select AC coupling to view small AC signals on a DC signal.
Procedure to invert the waveform display for better viewing.
How to continuously adjust input sensitivity for specific signal amplitudes.
How to add, subtract, or multiply two waveforms, and use XY-mode.
How to use the Spectrum function to analyze spectral content via FFT.
How to create and display a reference waveform for visual comparison.
How to use a waveform envelope as a template for Pass-Fail testing.
Overview of automatic meter measurements and display of numeric readings.
Steps to choose a current measurement for input A.
Procedure to adjust the reference value for relative measurements.
Describes using the banana jack inputs for Meter functions.
Steps to measure resistance using the test tool.
Steps to set up the test tool for a typical current measurement using a probe.
How to activate manual ranging for meter measurements.
Demonstrates making a relative measurement and its display.
How to access the recorder functions from the main menu.
Using TrendPlot to graph scope or meter measurements over time.
Steps to start and stop a TrendPlot recording.
Viewing recorded data in normal or overview mode.
How to change the time reference for the recorder display.
How to start recording scope waveforms in deep memory.
Using Single Sweep to automatically stop recording when deep memory is full.
How to start or stop recording based on a trigger signal.
Storing and stepping through the 100 most recent screens.
How to step through stored scope screens sequentially.
How to continuously replay stored screens like a video.
Using triggered mode to capture and replay intermittent signal anomalies.
How to use the ZOOM function to get a more detailed view of a waveform.
How to use horizontal cursors for voltage measurements and amplitude analysis.
Using vertical cursors for time, mVs-mAs-mWs, or RMS measurements.
Using cursors on mathematical waveforms (e.g., AxB) for specific readings.
Using cursors on spectrum measurements to observe readings.
How to measure rise time using cursors and selecting waveform and manual/auto mode.
How to measure fall time using cursors and selecting waveform and manual/auto mode.
How to set trigger level, slope, and delay for stable waveform display.
How to configure automatic trigger behavior for different frequency ranges.
Steps to trigger on rising edges of an input waveform.
Using trigger filters like Noise Reject or HF Reject for noisy waveforms.
How to perform a single shot acquisition to catch single events.
How to set N-Cycle triggering for stable burst waveform pictures.
How to use external triggering with automatic or edge triggering.
How to trigger on narrow positive pulses shorter than 5 ms.
How to find missing pulses by triggering on gaps bigger than 110 ms.
Describes the test tool's USB-host and mini-USB-B ports for data storage and PC connection.
Information on installing USB drivers for computer communication.
Lists internal memory locations for screens, setups, records, and trendplots.
Procedure to save a screen and its associated setup to internal or USB memory.
How to rename saved screens and setups according to user preference.
How to save a screen image in bitmap (.bmp) format (print screen).
Procedure to delete screens and associated setups from memory.
How to recall saved screens and setups for analysis or configuration.
Steps to recall a setup configuration to restore operating parameters.
How to scroll through and view stored screens in memory.
Procedure to modify the names of stored screens and setup files.
How to copy or move files between internal memory and a USB device.
Using FlukeView 2 software to upload waveform data and screen bitmaps to a PC.
Instructions for connecting the test tool to a PC using a USB cable.
How to set up a wireless connection using a WiFi USB Adapter.
How to open and navigate the Motor Drive Main Menu for measurements.
Checking drive input conditions like voltage and current quality.
Checking the DC-bus of the drive for voltage and ripple.
Checking drive output conditions like modulated voltage and current.
Checking motor input conditions and cable influence.
Detecting bearing flash-over currents caused by high shaft voltages.
Measuring supply voltage, current, and frequency at the Motor Drive input.
Tips for comparing RMS voltage and checking for out-of-range conditions.
Formula and explanation for calculating voltage unbalance in 3-phase systems.
Tips on causes and mitigation of voltage unbalance issues.
Formula and explanation for calculating current unbalance in 3-phase systems.
How to view harmonic components of voltage and current signals.
Checking the value and stability of the internal DC-bus voltage.
Detecting rapid fluctuations and AC components on the DC-bus.
Measuring voltage, current, and frequency with a 10 kHz bandwidth filter.
Using V/Hz ratio to check motor limits and potential issues.
Shows modulated signal between 2 phases, including PWM voltage and frequency.
Adjusting zoom level and time base for detailed pulse analysis.
Measuring high voltage peaks to ground, and understanding signal fluctuations.
Measuring with DC bus reference for switch frequency and IGBT issue identification.
Using FFT to analyze spectral content of motor drive output voltage waveform.
Checking differences between phase-phase voltages and their impact on motor operation.
Checking differences between phase currents and their impact on motor performance.
Detecting bearing flash-over currents that damage motor bearings.
Illustrations show the use of standard accessories like voltage probes and leads.
Explains benefits like simultaneous measurements and additional safety.
How to connect references to system ground or stable voltage due to parasitic capacitance.
Illustrates correct and incorrect methods for connecting reference leads.
Safety warnings and general cleaning procedures for the test tool.
How to store the test tool and Li-ion batteries for extended periods.
Recommendations for storing Li-ion battery packs safely.
Recommendations for safe usage and handling of the battery pack.
Instructions on how to charge the Li-ion batteries using the power adapter.
Steps to calibrate 10:1 voltage probes for optimal response.
Shows the display during voltage probe adjustment.
How to display model number, software version, serial number, and calibration dates.
How to display battery status, serial number, capacity, and remaining time.
Lists part numbers for common replacement accessories like adapters and probes.
Continues the list of replacement parts, including batteries and hangstraps.
Details optional voltage probe sets and their included items.
Lists optional probe accessory extension sets and their components.
Describes optional software kits and carrying cases.
Troubleshooting steps for the test tool shutting down after a short time.
Troubleshooting steps when the test tool screen remains black.
Procedure for handling a software hangup preventing the test tool from turning off.
Troubleshooting steps when the PC does not recognize the test tool.
How to troubleshoot battery-operated accessories that are not functioning.
| Bandwidth | 200 MHz |
|---|---|
| Input Channels | 2 or 4 |
| Vertical Resolution | 8 bits |
| Storage Temperature | -20 °C to +60 °C |
| Display | Color LCD |
| Connectivity | USB, Ethernet |
| Input Impedance | 1 MΩ |
| Operating Temperature | -10 °C to +50 °C |