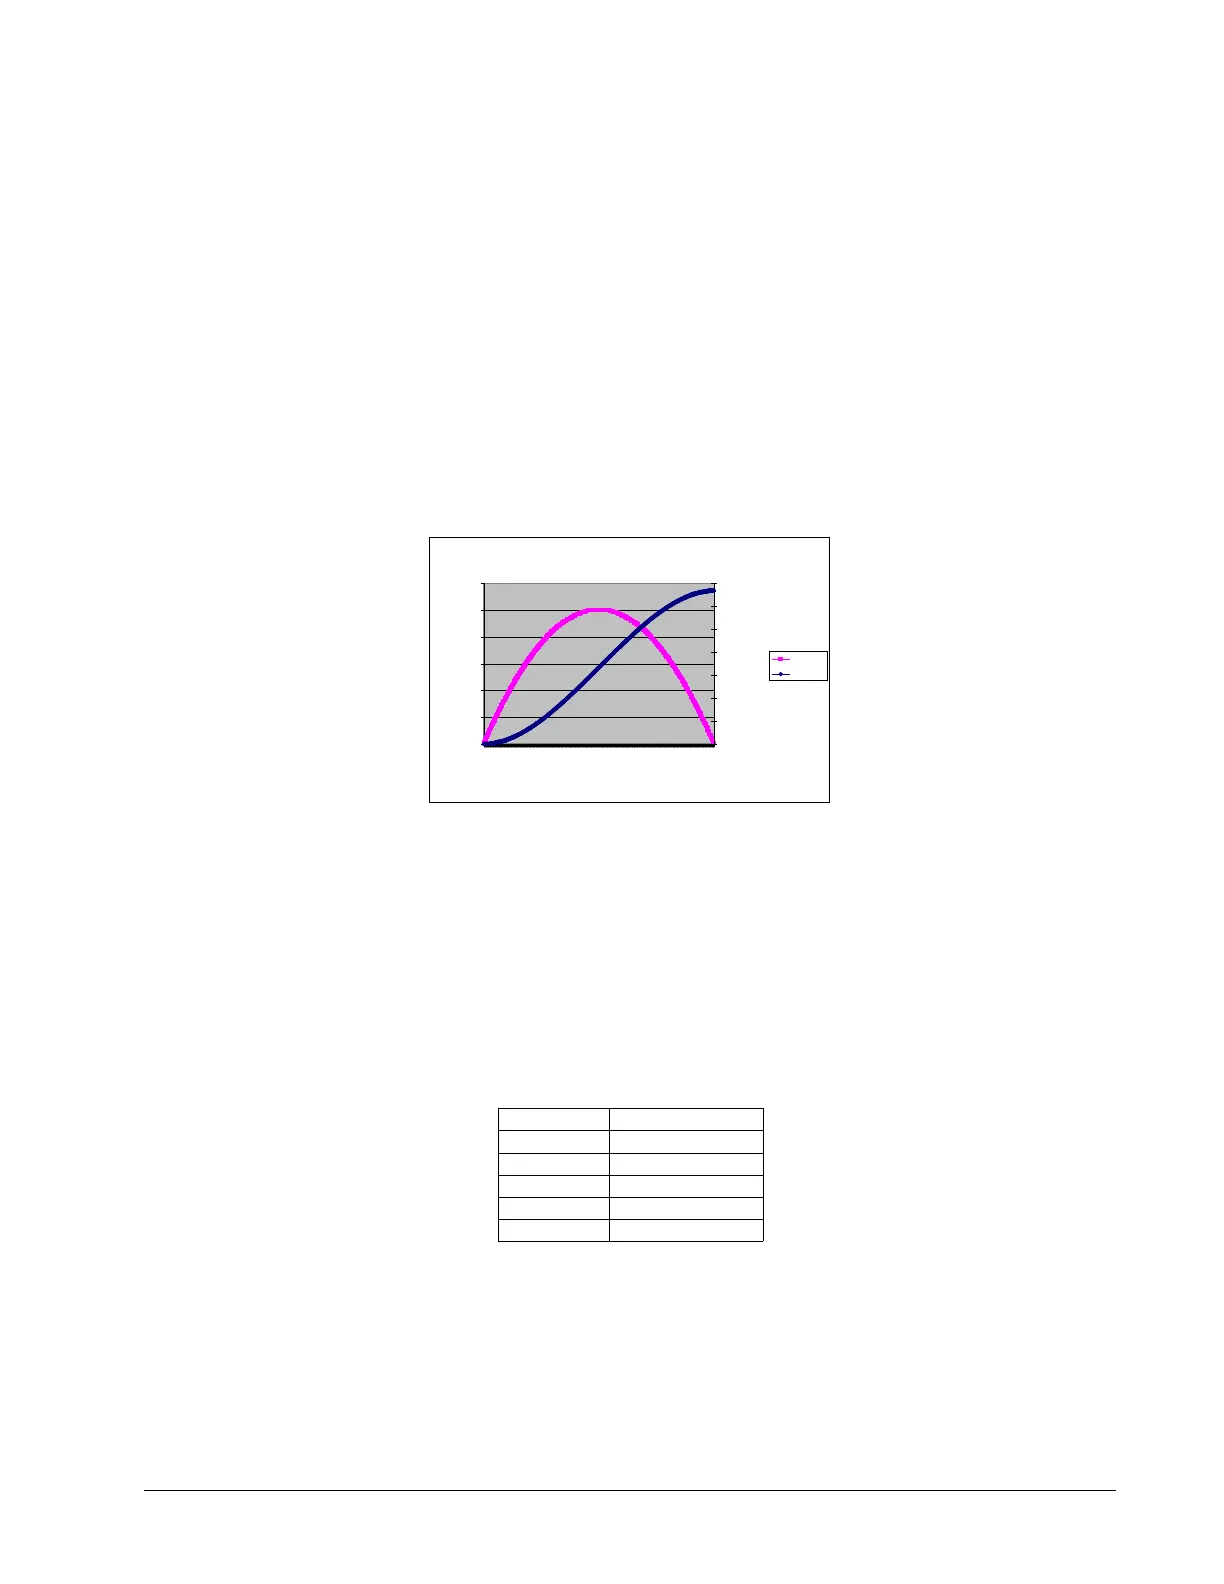
The DMC program is shown below and the results can be seen in Figure 6.16.
INSTRUCTION INTERPRETATION
#PVT
Label
PVX = 57,437,256
Incremental move of 57 counts in 256 samples with a final velocity of 437 counts/sec
PVX = 151,750,256
Incremental move of 151 counts in 256 samples with a final velocity of 750 counts/sec
PVX = 214,937,256
Incremental move of 214 counts in 256 samples with a final velocity of 937 counts/sec
PVX = 245,1000,256
Incremental move of 245 counts in 256 samples with a final velocity of 1000 counts/sec
PVX = 245,937,256
Incremental move of 245 counts in 256 samples with a final velocity of 937 counts/sec
PVX = 214,750,256
Incremental move of 214 counts in 256 samples with a final velocity of 750 counts/sec
PVX = 151,437,256
Incremental move of 151 counts in 256 samples with a final velocity of 437 counts/sec
PVX = 57,0,256
Incremental move of 57 counts in 256 samples with a final velocity of 0 counts/sec
PVX = 0,0,0
Termination of PVT buffer
BTX
Begin PVT
EN
Multi-Axis Coordinated Move
Many applications require moving two or more axes in a coordinated move yet still require smooth motion at the
same time. These applications are ideal candidates for PVT mode.
In this example we will have a 2 dimensional stage that needs to follow a specific profile. The application requires
that the certain points be met however the path between points is not important. Smooth motion between points
is critical.
X-axis Y-axis
500 500
1500 5000
2500 4000
3300 4200
7300 3300
The resultant DMC program is shown below. The position points are dictated by the application requirements and
the velocities and times were chosen to create smooth yet quick motion. For example, in the second segment the
B axis is slowed to 0 at the end of the move in anticipation of reversing direction during the next segment.
INSTRUCTION INTERPRETATION
#PVT
Label
PVA = 500,2000,500
1
st
point in Figure 6.21 - A axis
Chapter 6 Programming Motion ▫ 84 DMC-41x3 User Manual
Figure 6.16: Actual Velocity and Position vs Time of Parabolic Velocity Profile
Actual Velocity and Position vs Time
0
200
400
600
800
1000
1200
1400