75
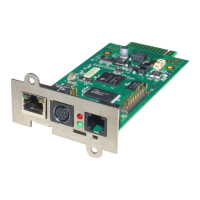
Figure 87: jChart Display of a Measurement Value
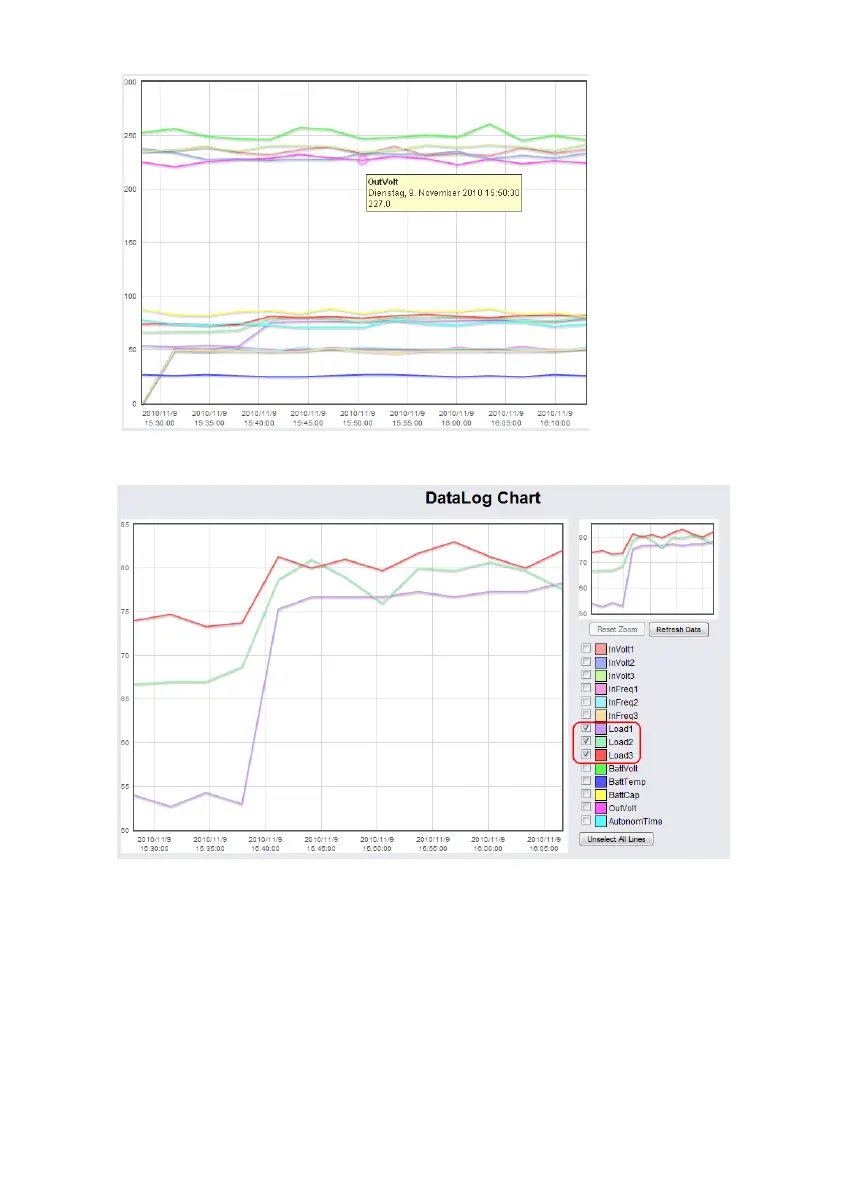
To display the desired values into the chart only, click the “Unselect All Lines” button and
check the accordant variables.
Figure 88: jChart Display of the Loads
To increase a desired area, click the left mouse button into the area and drag an accordant
rectangle from the upper left side to the lower right side.