76
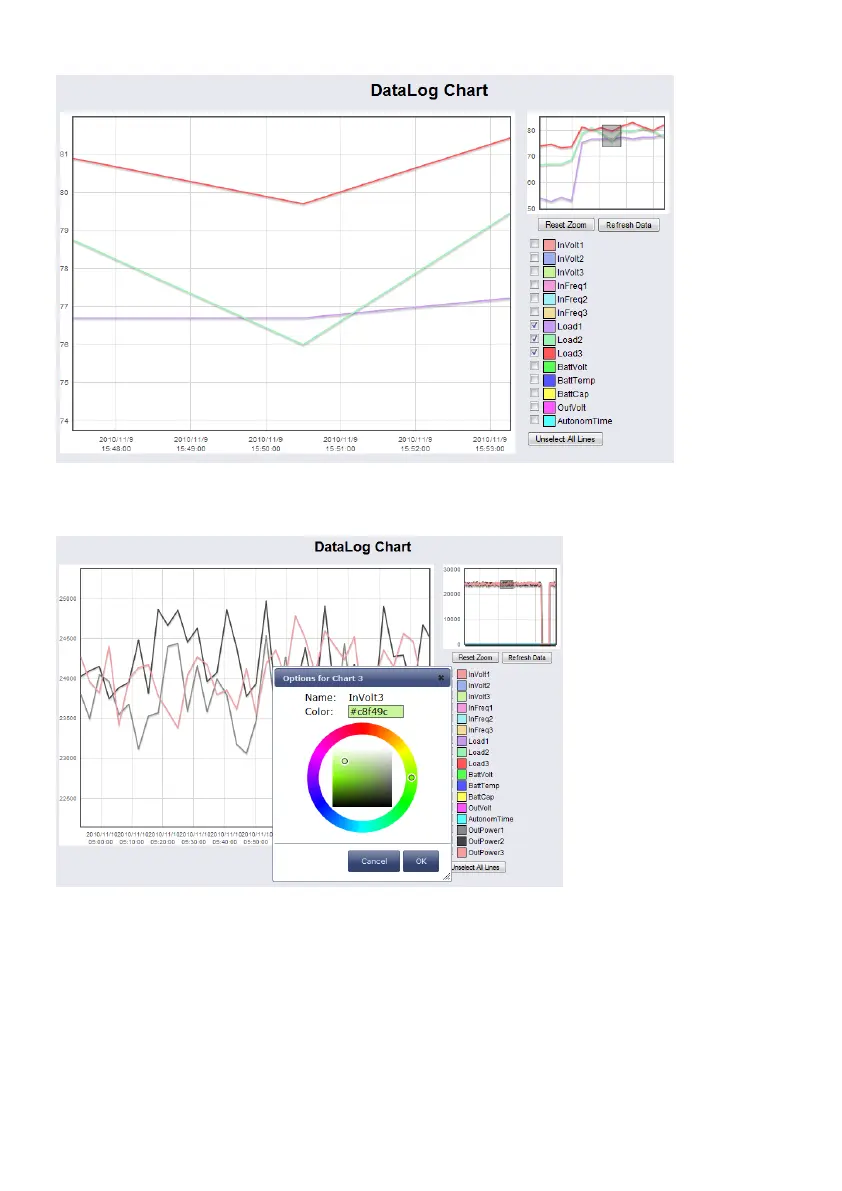
Figure 89: jChart – Zoom-In of an Area
Click the “Reset Zoom” button, if you want to get back to the initial state. If you want to change
the colours for the values, click the coloured box prior of the variable.
Figure 90: jChart – Colour Selection
6.3 gChart
gChart is a GENEREX plug-in for the MS Internet Explorer available as a free download from
the GENEREX web site. Quickly and easily visualise all of the CS121-adapter logfiles using
Generex's ActiveX graphical log controller GChart when using the Internet Explorer. Discover
UPS problems more easily and optimise system tuning more rapidly. Navigate through the
data with the mouse using functions like zoom and pan with continuous motion in real time and
query interpolated data values by clicking in the areas of interest. Customize the view by
moving or toggling off the legend, toggle off and on the data grid and also switch individual log
values on and off.