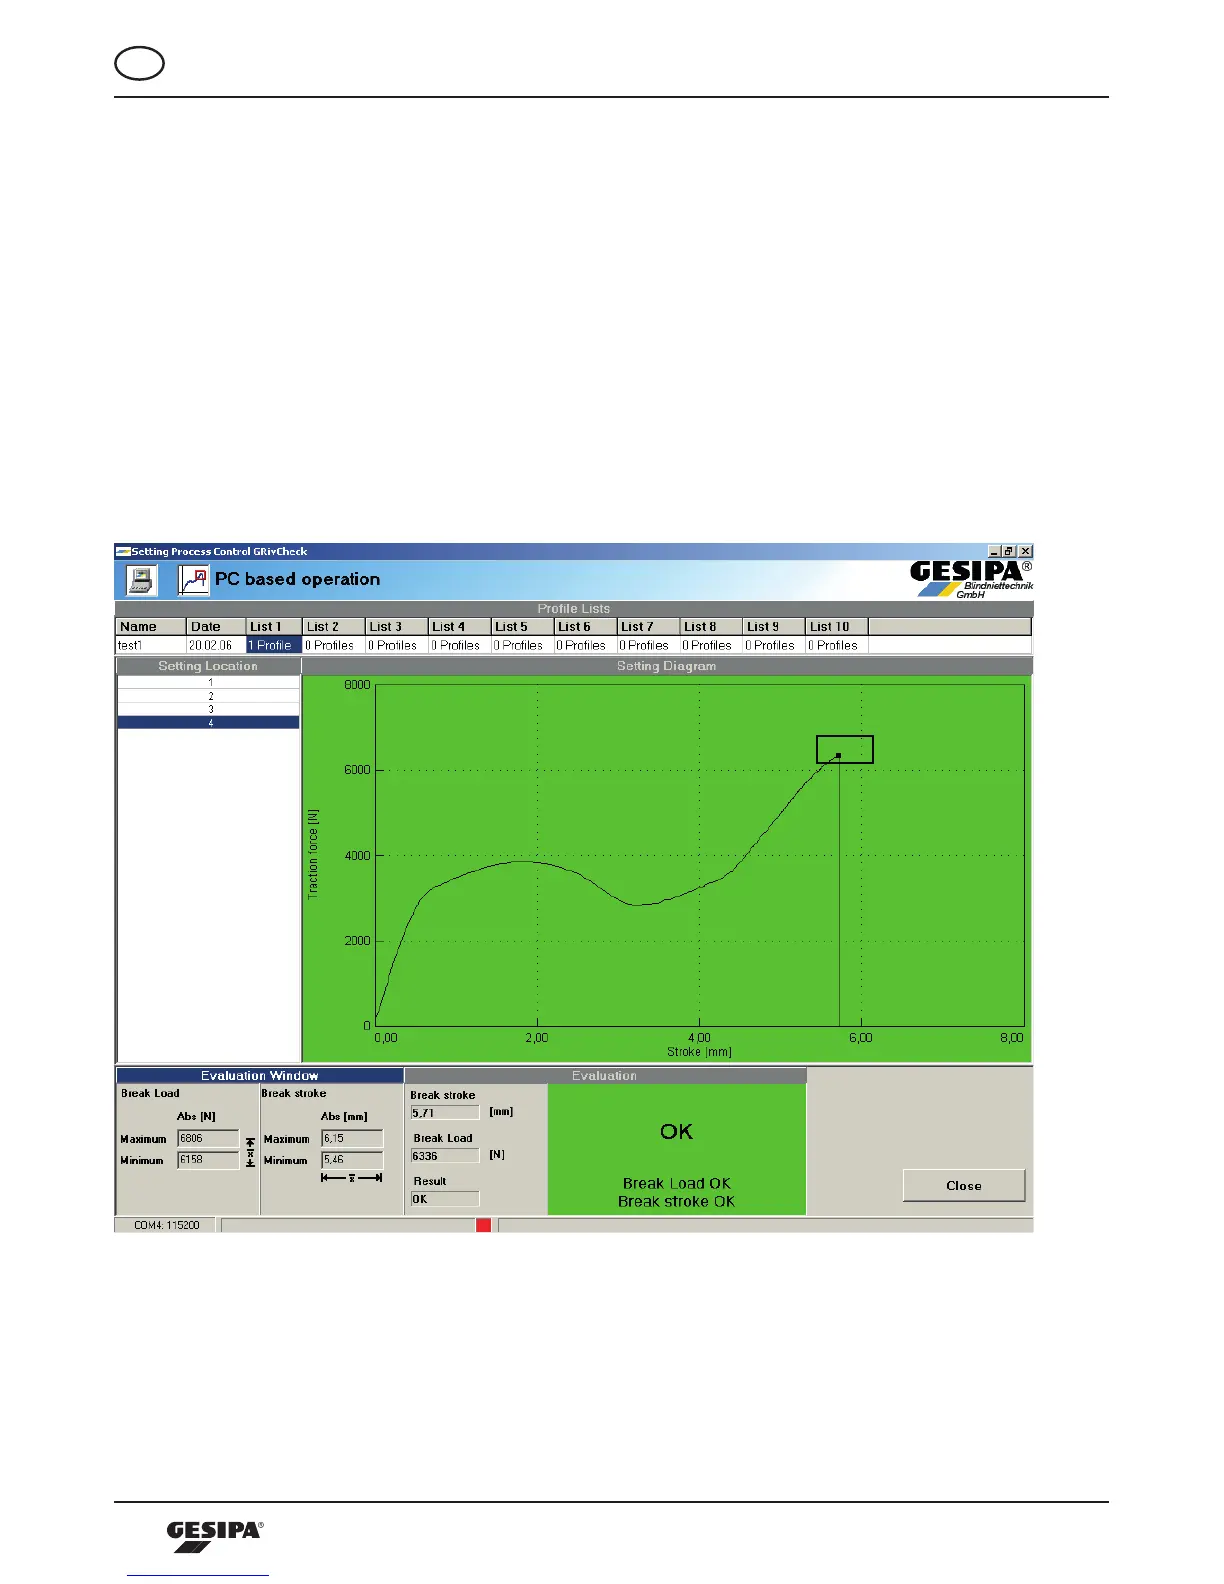
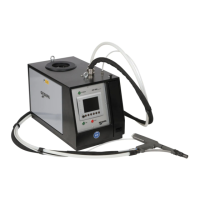
In the header area of the screen the profile lists with their respective number of profiles are displayed. The
active profile list is highlighted in blue. In the left hand area the blind rivet locations are displayed; three
in this example. The active profile list starts according to the setting sequence on blind rivet location 1. By
clicking the respective blind rivet location in the table it is possible to switch to that blind rivet location of
the setting sequence. By clicking the respective profile list in the header area it is possible to switch there.
The process sequences and evaluation are visualized online on the screen. The pulling force –pulling
strokediagramisdisplayedinthefieldForce-Stroke-Sequencedirectlyafterendingthesettingprocess.
The coordinates of the corresponding evaluation window are represented in the evaluation window field.
Thebreakstrokeandthemandrelbreakforcearelistedintheevaluationfield.IncaseofanOK-evalua-
tion of the setting process the evaluation field has a green background, illustration 27. In case of n/OK
evaluation of the setting sequence the evaluation of the type of error is represented in the evaluation field
while the field has a red background, illustration 28.
Illustration 27: Representation of the setting process monitoring of an OK connection