Thistablecanbeexportedascsvfilebyclickingthe-buttonbymeansofthedialogue.Thesettings
of the export format are described in chapter 4.5.
Byclickingthe-buttonthestatisticalanalysisoftheprocessdatacanbevisualized.Theprocess
data marked in the calendar are analyzed according to the application as well as the blind rivet locations
in regards to their error type, and represented in a table. The stated period is shown in the header line of
the screens.
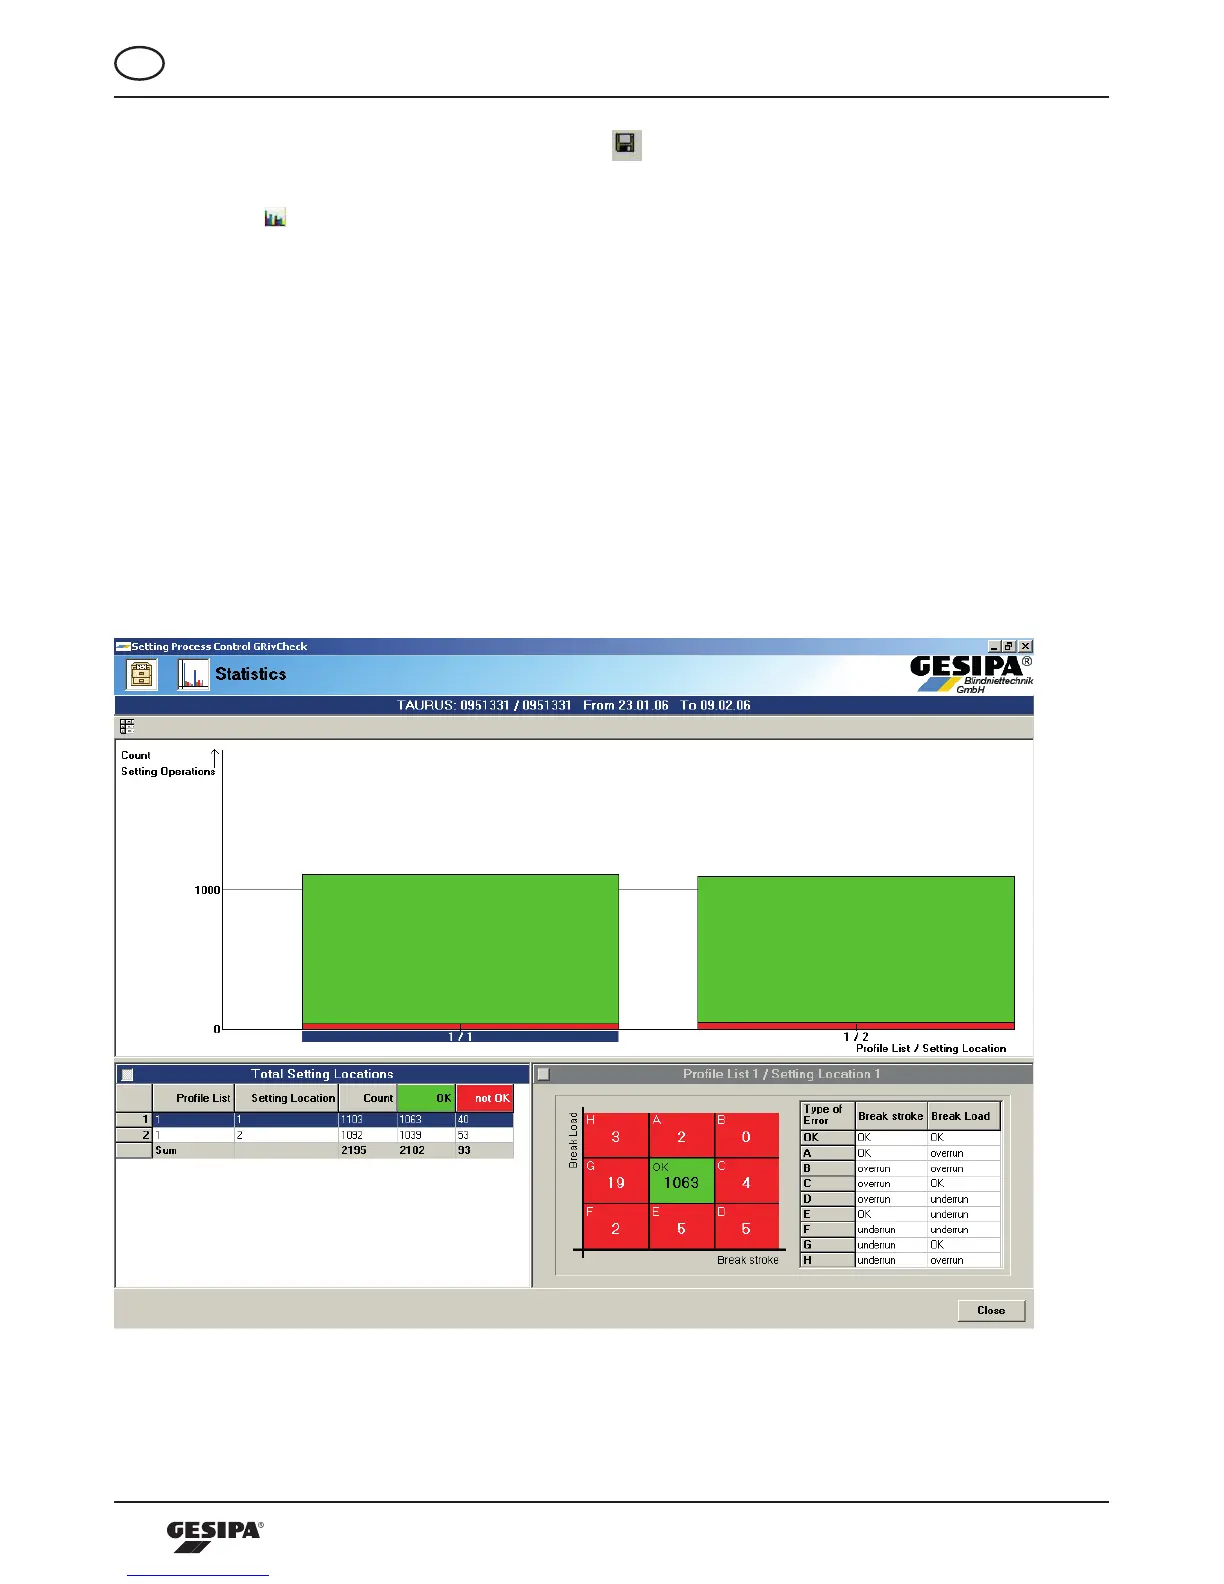
At first the application representation is generated, i.e. analysis of the process data of all blind rivet spots
regarding error type and error frequency. The bottom left field “Total number blind rivet location“ is active
and therefore has a blue background. The value table in this field provides and overview of the number of
setting processes and of the OK as well as n/OK evaluations, illustration 32.
Byclickingthewindow“ProfileListO/blindrivetspotsO“ortherespectivecolumnsinthediagrama
blindrivetlocation-specificevaluationconcerningerrortypesonthisblindrivetlocationcanbegenerated,
illustration 33. In the now active right bottom window the distribution of error types are represented in a
tableaswellasinaforce-strokediagram.Youcanfreelytogglebetweenthoserepresentations.
Illustration32:Component-specificprocessdataanalysis