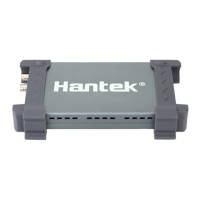
Hantek 6022BE
2) Set the Trigger Sweep to Single.
3) Set the Trigger Source to CH1.
4) Set the Trigger Slope to “+” which means you select the rising edge.
5) Adjust the Volts/Div and the time base in a proper range for the signal.
6) Drag the trigger level sign on the waveform display screen to proper
position. It’s usually higher a little above the normal level.
7)
Click to start capturing. When the trigger conditions are met, data
appears on the display representing the data points that the
oscilloscope obtained with one acquisition.
.
The Application of the X-Y Operation
X-Y Plot acts to analyze correlation of data of two channels. Lissajous
diagram is displayed in the screen when you use X-Y Plot, which enables to
compare frequencies, amplitudes and phases of counterpart waveform
against the reference waveform. This makes it possible to compare and
analyze frequency, amplitude and phase between input and output.
Do these steps as follows:
1.
Set the probe attenuation to “x10”. Set the switch to “x10” on the probes.
2. Connect the CH1 probe to the input of the circuit, and connect the CH2
probe to the output of the circuit.
3.
Click ”Autoset” button.
4. Adjust the vertical scale and offset to display approximately the same
amplitude signals on each channel.
5. Select X-Y format at Horizontal window. The oscilloscope will displays a
Lissajous pattern representing the input and the output characteristics of
the circuit.
6.
Adjust the scale and offset of the horizontal and vertical to a desirable
waveform display. The following picture shows a typical example.
7.
Apply the Ellipse Method to observe the phase difference between the two
channels.
55
The User’s Manual