NanoPhotometer
®
N120/NP80/N60/N50/C40 User Manual Version 4.3.1
34
MEASUREMENT SCREENS
SINGLE SAMPLE METHODS
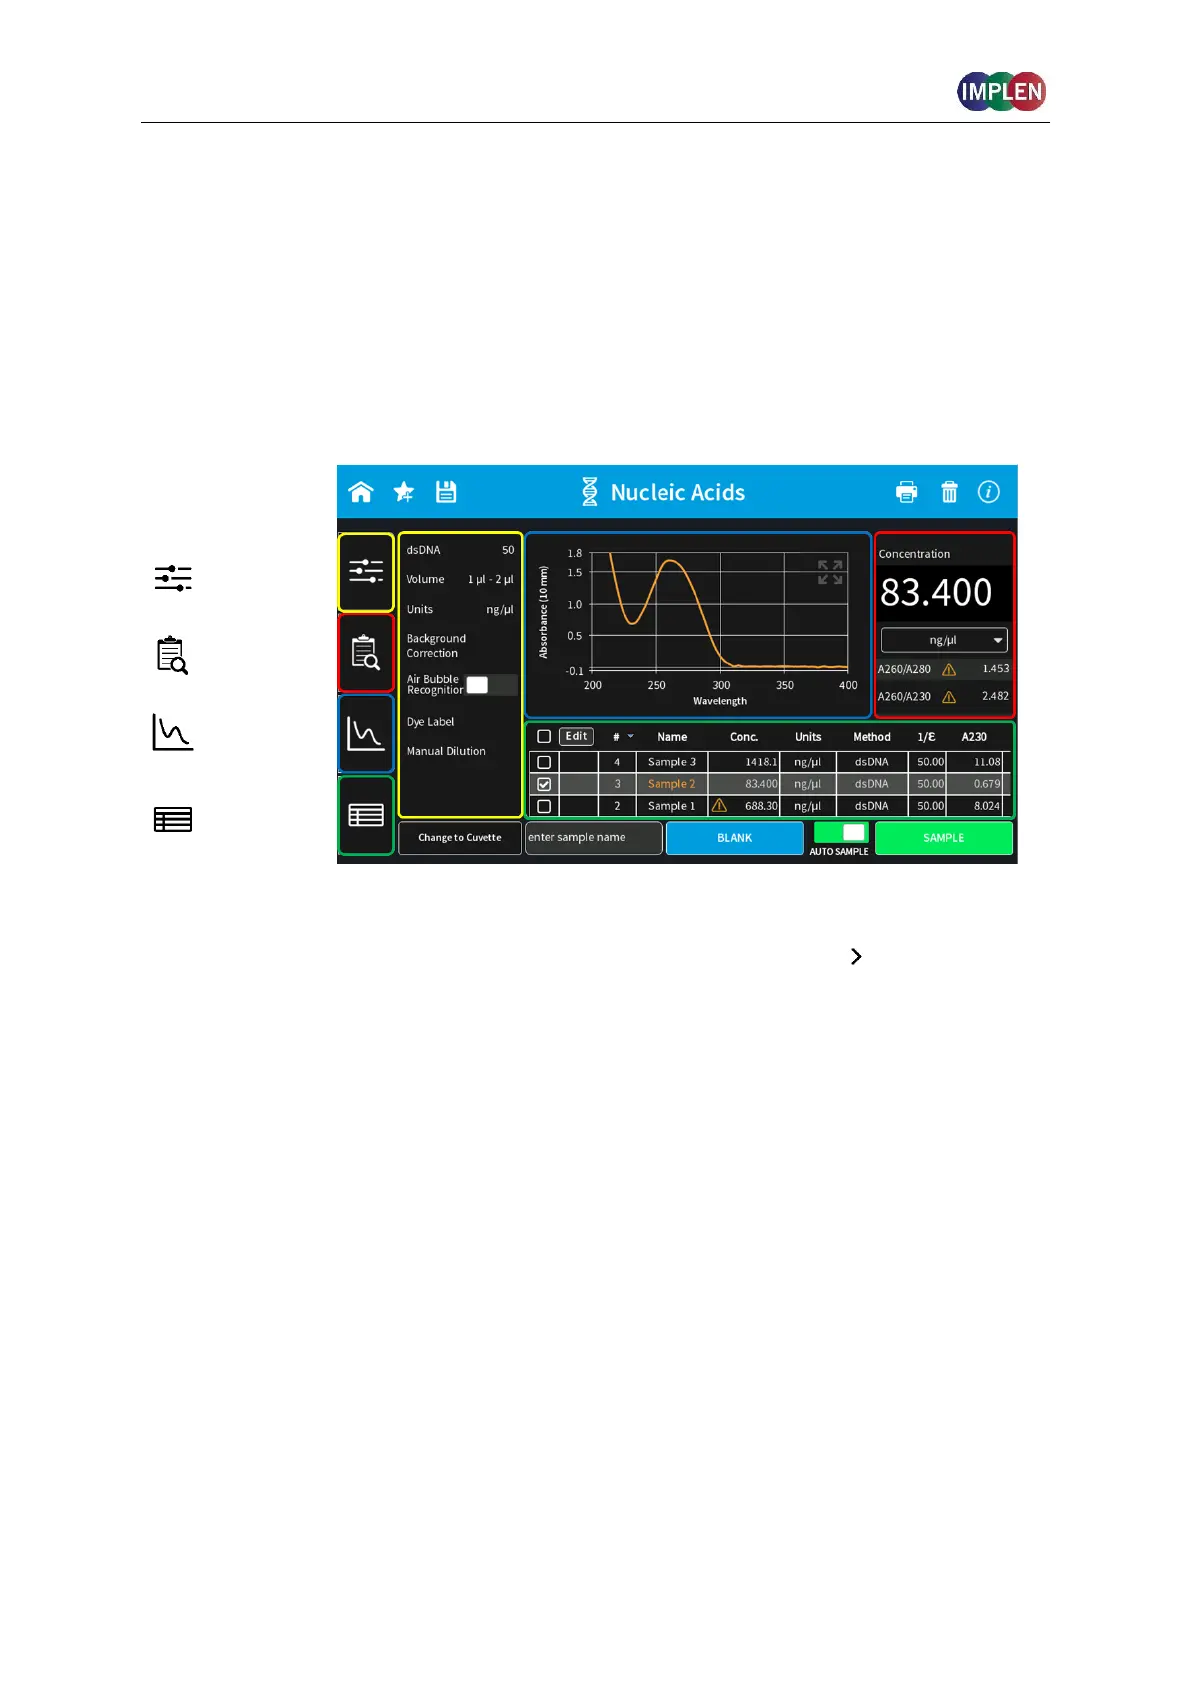
Side Tab Bar
On the left side of the measurement screen there is a vertical tab bar that contains four tabs
including: parameters, results, graph, and table. The different tabs allow the user to organize
the measurement screen. It is possible to show or hide the different areas on the screen.
Default screen for computer shows all areas, for the built-in screen and the tablet version the
table is hidden.
Note: There is no tab bar available for smartphone versions. The parameter, results and
graph screens are shown full screen. Parameters need to be confirmed ( ) to get to the
measurement screen. It is possible to toggle between the results and graph area by swiping
left and right. There is no table area available for smartphones.
Parameter area
In the parameter area it is possible to define all necessary parameters for a measurement as
well as turn on cuvette mode and initiate cuvette heating. The standard measurement screen
shows the parameter area open by default. The parameter area is automatically hidden
when starting either a blank or sample measurement by pushing on the Blank or Sample
button. It is also possible to hide the parameter area by tapping the parameter tab in the
vertical side tab bar.
Results area
The results area shows the method specific results of the grey highlighted measurement in
the table including concentration, absorbances, and relevant ratios. It is also possible to
change the units of the calculated concentrations in the results area with a dropdown
selection menu.
Table area
The table area collects the results of all samples in an active method. The first table column
shows a tick box. Selecting the samples with the tick box the graphs are overlaid in the