tinb29e1-c (2019-10) VGC083A_B.om 63
Convection gauge operation is based on the physical effect of thermal conductivity
of the gas inside the gauge head. The convection gauge senses heat loss in a
sensor wire. This heat loss depends on the thermal conductivity of the gas sur-
rounding the sensor wire. Since different gases, and mixtures, have different ther-
mal conductivities, the indicated pressure readings and outputs will also be differ-
ent. INFICON convection gauges (and most other thermal, heat loss type gauges)
are normally calibrated using nitrogen. When a gas other than N
2
is used, correc-
tion must be made for the difference in thermal conductivity between N
2
and the
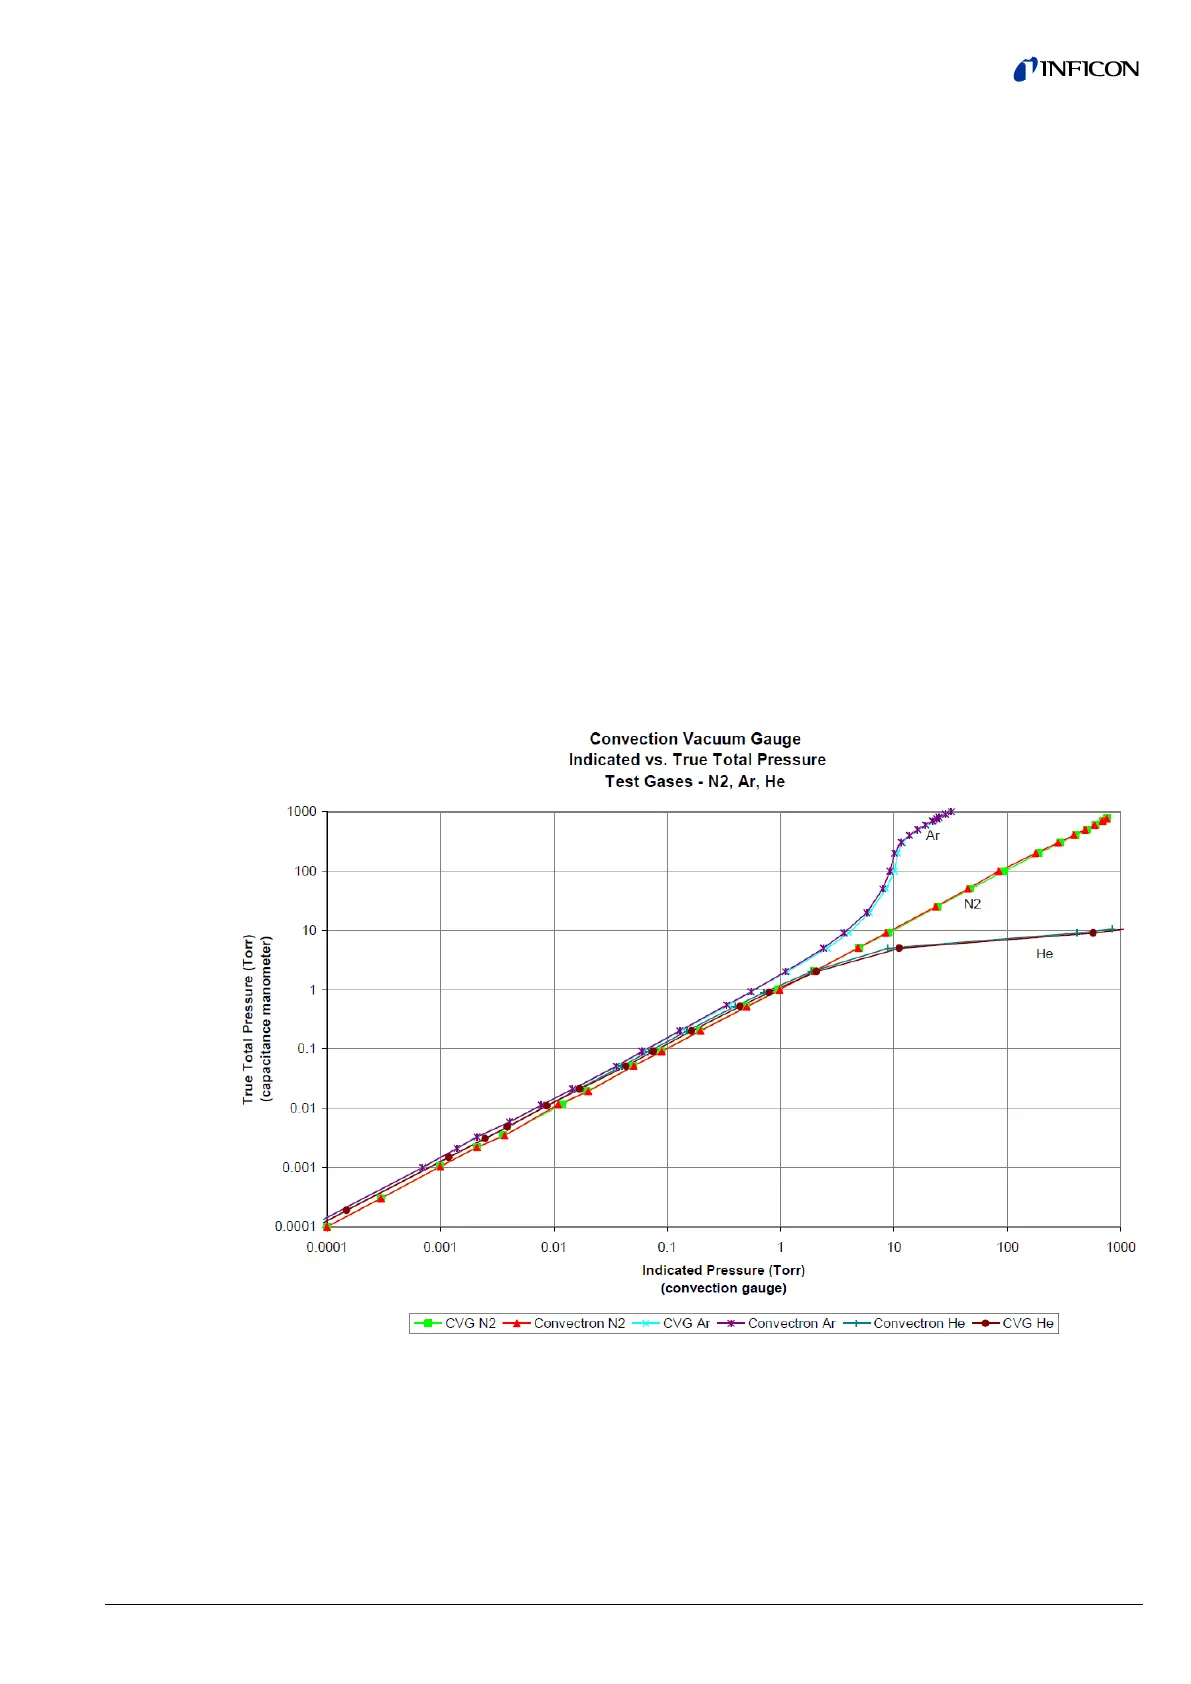
gas in use. The charts and tables below indicate how different gases affect the dis-
play from an INFICON convection gauge.
For nitrogen gas (N
2
) the calibration of the convection gauge shows excellent
agreement between indicated and true pressure throughout the range from 10
-4
to
1000 Torr. At pressures below about 1 Torr, the calibration curves for the different
gases are similar. The difference in readings (between indicated and true pressure)
at these low pressures is usually a constant; a function of the difference between
thermal conductivities of the gases.
At pressures above about 1 Torr, indicated pressure readings may diverge signify-
cantly from true pressure. At these higher pressures, convection currents in the
gauge become the predominant cause of heat loss from the sensor. Calibration
and performance at pressures higher than about 1 Torr depends on gauge tube
geometry and mounting orientation as well as gas properties.
Generally, air and N
2
are considered the same as far as thermal conductivity goes,
but even these two gases will exhibit slight differences in readings at higher pres-
sures. For example, when venting a system to atmosphere using N
2
, you may see
readings change by about 30 to 40 Torr after the chamber is opened and air gradu-
ally displaces the N
2
in the gauge. This is due to the partial pressure of oxygen (O
2
)
contained in atmospheric air.
The Y- axis of the above chart is actual pressure as measured by a capacitance
manometer, a diaphragm gauge that measures true total pressure independent of
gas composition. The X-axis is the pressure reading indicated by the convection
gauge under test. This chart shows readings for an INFICON convection gauge
(CVG) and Granville-Phillips
®
Convectron
®
gauge to illustrate that the difference in
the response for both of these types of gauges is virtually indistinguishable.
8.2 Effects of Different
Gases on Convection


 To Next Page