41
5.5 Interpreting the signal on the oscillogram
The LEADER Scan combines a detection zone (cone) and an oscillogram (graph) of detected
movements on the screen. Movements are interpreted on the curve. (Number of movements and
intensities of these movements).
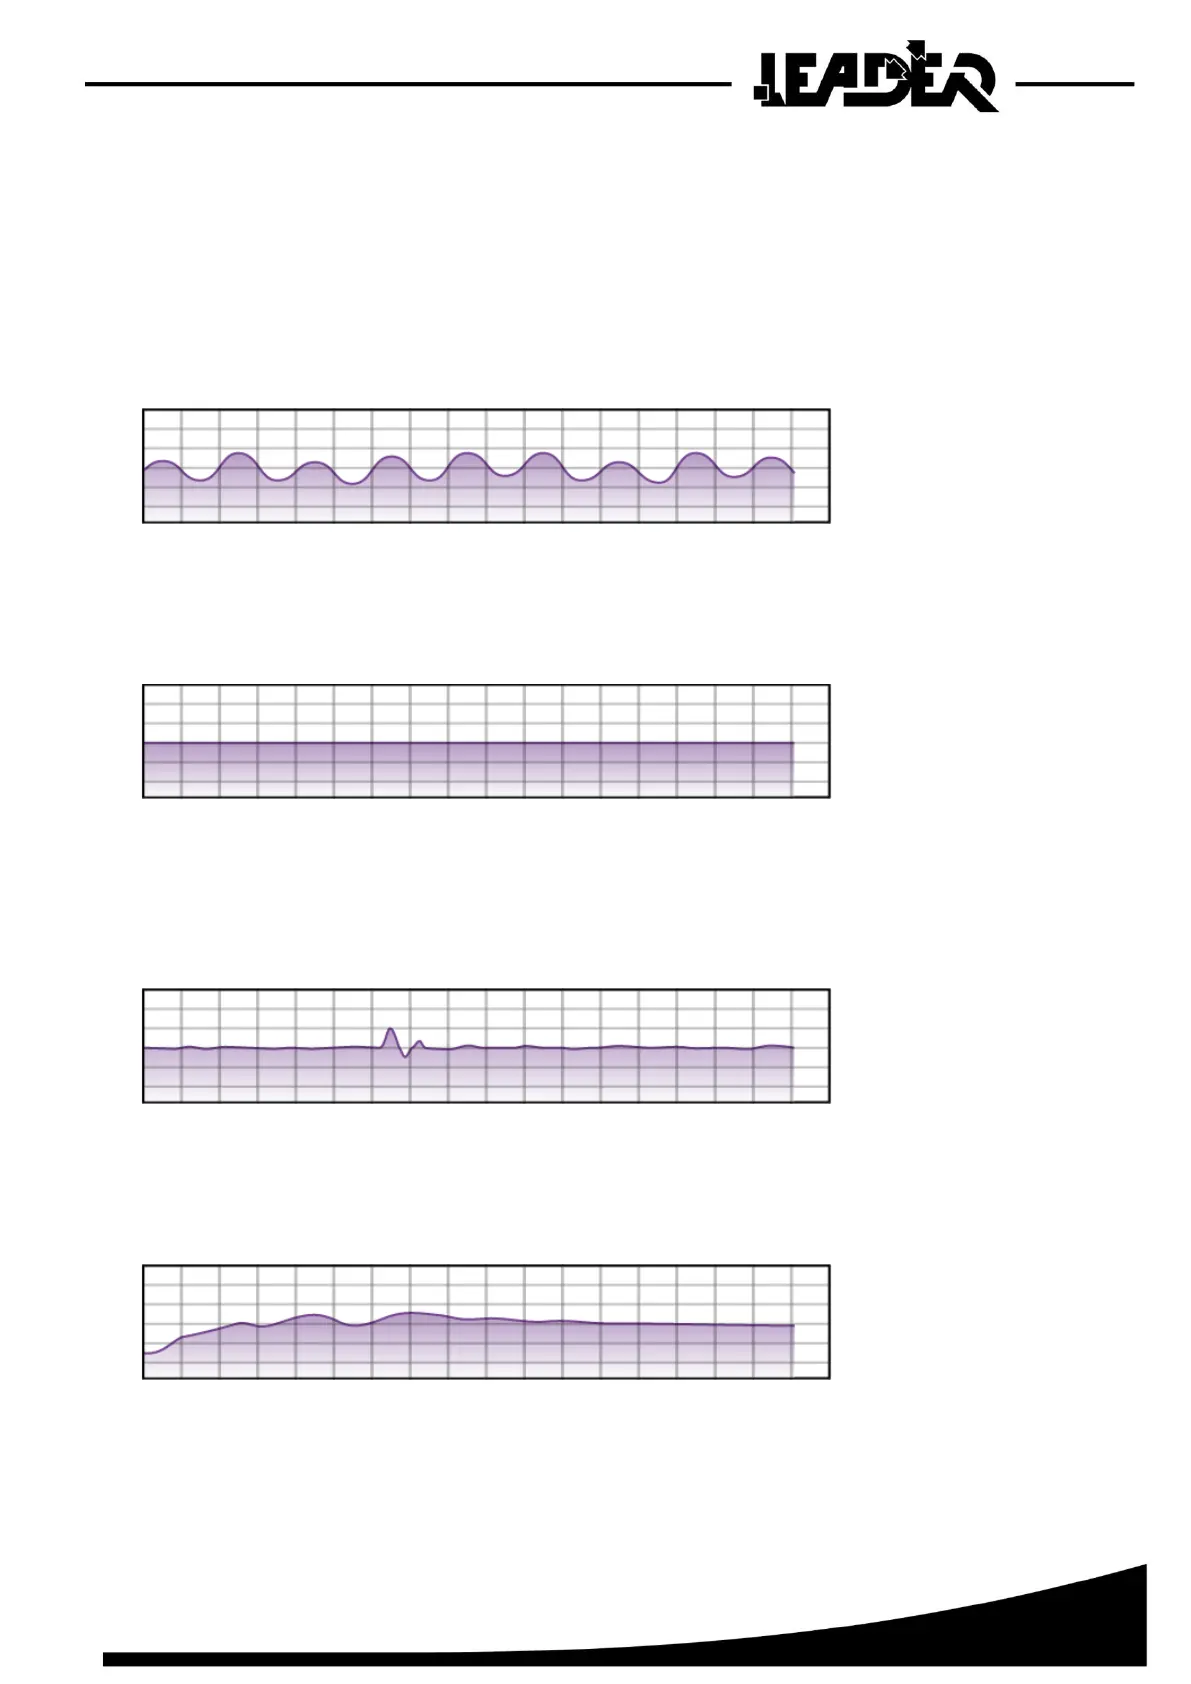
- If the curve is sine curve, the user is in the presence of repeated movement
(breathing, victim tapping regularly...).
- The following curve shows that the device has not yet started searching
(“Real time” or “Automatic”).
- The following curve shows a non-repeated movement which could be due to a stone rolling
through the UWB detection cone during a search in progress.
- The following curve shows movements which must be strong
(start of the curve) but which seem to reduce and disappear.